When precious metals are mined, ores are removed from the ground and subjected to different sample preparation steps to extract the desired metals. Fire-assay is a standard procedure used for separating metals from ore, leaving a matrix-free “button” of the metal. Suitable acids are then used to dissolve this button for analysis.
If the quantity of sample utilized in the sample preparation is known, then it is possible to determine the metals’ concentration in the ground. These investigations are often carried out with flame atomic absorption (AA) spectrometry, thanks to its robustness, simplicity, analytical speed, and low cost.
This article discusses the analysis of precious metals in simulated fire assay samples, with a special focus on the evaluation of the lowest levels which can be determined precisely.
Experimental Framework
All analyses were carried out on PerkinElmer’s PinAAcle™ 500 Flame AA spectrometer using a 10 cm burner head and the conditions outlined in Table 1. Using self-aspiration, all standards and samples were introduced via the highly sensitive nebulizer with the spacer removed.
Table 1. PinAAcle 500 AA spectrometer instrumental conditions.
| Parameter |
Gold (Au) |
Palladium (Pd) |
Platinum (Pt) |
Copper (Cu) |
Silver (Ag) |
| Wavelength (nm) |
242.80 |
244.79 |
265.94 |
324.75 |
328.07 |
| Slit (nm) |
0.7 |
0.2 |
0.7 |
0.7 |
0.7 |
| Lamp |
HCL |
HCL |
HCL |
HCL |
HCL |
| Air Flow (L/min) |
4.40 |
4.40 |
4.40 |
4.40 |
7.80 |
| Acetylene Flow (L/min) |
1.58 |
2.02 |
2.02 |
1.86 |
2.02 |
The flame conditions were optimized to render a stable signal and maximum sensitivity. Three replicates and a three-second integration time were utilized for all analyses. Following this, standards were prepared in 15% aqua regia (gold, platinum, and palladium) or 2% HNO3 (silver, copper) to replicate the dissolution of a button sample following sample preparation based on the fire-assay procedure.
Results and Discussion
By establishing low-level calibration curves with regression values greater than 0.999, it is possible to assess the precise measurement of low concentrations. It was observed that the lowest standards were those whose absorptions were typically higher than the blank and provided relative standard deviations or RSDs of less than 5%.
Lower concentrations can be determined for individual elements, but the RSDs were found to be greater than 5%, a statistical outcome when small numbers are being considered.
Table 2 depicts the calibration standards, and Figure 1 shows the resulting calibration curves. In order to evaluate the precision of the measurements, a standard at the center of the individual calibration curve was measured, with results shown in Table 3.
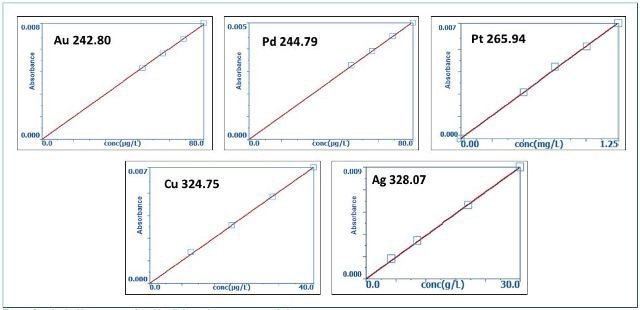
Figure 1. Low-level calibration curves for gold, palladium, platinum, copper, and silver.
Table 2.Low-level calibrations
| Element |
Calibration Standards (µg/L) |
Calibration Type |
| Au |
50, 60, 70, 80 |
Linear Through Zero |
| Pd |
50, 60, 70, 80 |
Linear Through Zero |
| Pt |
500, 750, 1000, 1250 |
Linear Through Zero |
| Cu |
10, 20, 30, 40 |
Linear Through Zero |
| Ag |
5, 10 20, 30 |
Linear Through Zero |
Table 3. Mid-level standard quantitative read back.
| Element |
Standard (µg/L) |
Read-Back (µg/L) |
% Recovery |
| Au |
65 |
67.7 |
104 |
| Pd |
65 |
69.2 |
106 |
| Pt |
850 |
836 |
98 |
| Cu |
25 |
24.1 |
96 |
| Ag |
15 |
14.5 |
97 |
Given the significance of determining precious metals at low levels, the limits of detection were established under the same timings and instrumental conditions as the quantitation and calibration analyses (Table 4) using the formula given below:
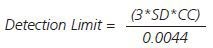
SD is the standard deviation and CC is the characteristic concentration.
Table 4. Detection limits
| Element |
Matrix |
Detection Limit (µg/L) |
| Au |
15% aqua regia 1% HNO3 |
10.5 8.2 |
| Pd |
15% aqua regia 1% HNO3 |
13.7 14.2 |
| Pt |
15% aqua regia 1% HNO3 |
56.2 56.5 |
| Cu |
1% HNO3 |
2.1 |
| Ag |
1% HNO3 |
1.4 |
The typical concentration is established by running a standard, recording the absorbance, and utilizing the formula given below:
Characteristic Concentration = (Conc*0.0044)/Abs
Conc refers to the concentration of the standard, and Abs is the absorbance
Conclusion
This article has shown how PerkinElmer’s PinAAcle 500 Flame AA spectrometer allows precise measurement of silver, gold, copper, platinum, and palladium at low levels in matrices simulating the fire-assay preparation of ore samples.
Syngistix Touch™ software, which is operated from the touchscreen display of the PinAAcle 500 spectrometer, facilitates simple operation during sample analysis. If more flexibility is required Syngistix™ for AA software can be run from the PinAAcle 500’s on-board computer.
This software includes additional features, thus providing flexibility for method development, enabling offline post-analysis data reprocessing, and improving reporting capabilities, amongst other functions.
Besides improved software capabilities, the PinAAcle 500 Flame AA spectrometer can be used in corrosive environments due to acid-resistant coatings on instrument boards and the flame shield.
The PinAAcle 500 has improved analytical capabilities, flexible software options, and excellent corrosion resistance, thus making it a suitable system for determining precious metals for the mining industry.

This information has been sourced, reviewed and adapted from materials provided by PerkinElmer.
For more information on this source, please visit PerkinElmer.