Geological specimens contain a significant amount of information about their formation, much of which can be obtained using a scanning electron microscope (SEM) fitted with EBSD and EDS analytical detectors and software.
The set of information obtained through mapping and dedicated mineral analysis software provides a better insight into the samples and processes which have contributed to its formation than separate techniques alone.
This article describes the analysis of a mantle peridotite thin section sample (Figure 1) performed over an area of 22.8 x 8.1mm using large area EDS and EBSD mapping together with a dedicated mineral analysis package called INCAMineral.
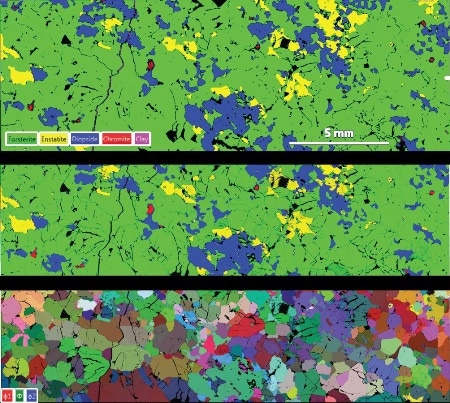
Figure 1. Top to bottom, AutoPhaseMap, EBSD Phase and EBSD grain orientation images of a single mantle peridotite sample.
Large Area EDS Mapping and AutoPhaseMap Software
Examination of geological samples offers intuitive results, demonstrating the distribution of elements within the specimen. Large Area EDS mapping with AZtec software helps in collecting considerable amount of compositional data, at particularly great speeds when multiple detectors are used.
With the help of AutoPhaseMap software, this elemental information can be automatically processed to ascertain where the distribution of elements is analogous and identify where distinct phases are present.
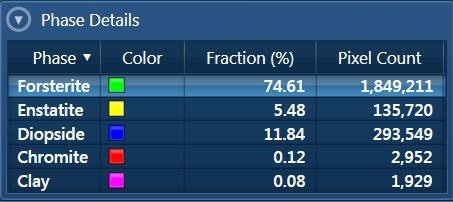
Figure 2. Phase assemblage as determined by AutoPhaseMap.
With the use of AutoPhaseMap software, mineral phases can be easily identified. Figure 2 shows the phase assemblage as determined by AutoPhaseMap. The collective spectra from all points which have been detected as a given phase can be observed, and quant results obtained from that spectrum can be expressed in terms of atomic proportions. This enables mineralogists to rapidly determine the possible phase as defined by the relative proportions of the elements present.
Large area EBSD mapping, which is also carried out in Aztec software, facilitates the identification of phases based on their crystallographic parameters and determines the grains’ orientation. This reveals vital information on the crystallisation history and strain relationships between different areas or different phases in the specimen.
INCAMineral: Mineral Analysis Package
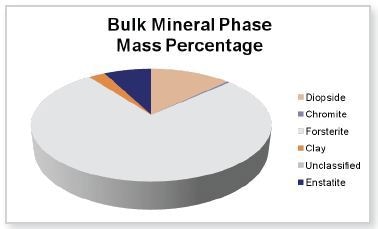
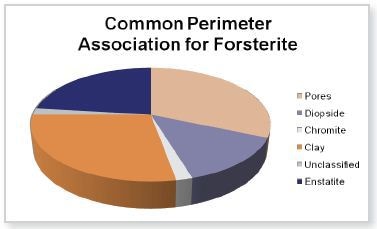
Figure 3. Bulk mineral phase mass percentage and common perimeter associations for forsterite. Data obtained by INCAMineral, processed with GrainAlyzer
INCAMineral is a dedicated mineral analysis package that enables mineralogists to obtain specific information on mineralogy. It determines information on mineral and porosity assemblage and common perimeter associations for modal samples (Figure 3).
This information can prove essential in ascertaining the history of the rock or its potential as a reservoir. Another suite of information on parameters such as associations and liberation within particles is determined for particulated samples.
Remarkable agreement can be achieved between classifications carried out on the basis of INCAMineral, EBSD phase mapping and AutoPhaseMap. As such, INCAMineral offers precise geological parameters of value to both petrologists and geologists.
Results and Discussion
The collective results from the three methods i.e AutoPhaseMap, EBSD phase mapping and INCAMineral demonstrate that the sample mainly contains diopsid, enstatite and forsterite with trace amounts of chromite.
A clay phase that exists at certain grain boundaries is possibly formed from the decomposition of the mafic minerals. Forsterite is also well associated with breaks in the sample and clay phases signifying that it is forsterite which has mostly contributed to clay formation.
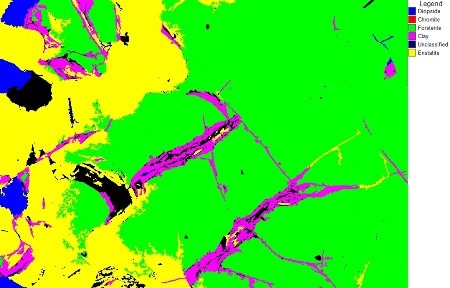
Figure 4. Mineral phase image based on classification scheme in use and summary of parameters of this field of view.
The three techniques closely agree on the sample’s bulk phase assemblage, giving immense confidence in the results. The distinct phase images of each field of view created by GrainAlyzer and INCAMineral reveal the associations between phases based on the classification scheme in use (Figure 4).
Specimen mapping demonstrates the distribution of minerals within the sample, indicating that the diopside occurs as large uneven grains in the forsterite. Strong fabric is not obvious in the grain orientation image, signifying that the specimen was under low strain conditions at the time of crystallisation.
Large area EDS and EBSD mapping together with the INCAMineral mineral analysis package provides a deeper level of mineralogy specific information. Identification of mineral phases and determination of grain orientation is made easy and simple, revealing vital information on the crystallisation history and strain associations between different phases in the sample.

This information has been sourced, reviewed and adapted from materials provided by Oxford Instruments Nanoanalysis.
For more information on this source, please visit Oxford Instruments Nanoanalysis.