Table of Contents
Introduction
Experimental - Instrumentation
Sample and Calibration Standard Preparation
Wavelength Selection and Background Correction
Spectral Interference Corrections
Results and Discussion
Conclusion
About Agilent Technologies Inc.
Introduction
Developing atomic spectrometric methodologies for geochemical sample analysis presents a number of challenges to commercial laboratories. The concentration range in geochemical analysis ranges from key elements present at percent levels, to trace elements that are present at sub-ppm levels.
Flame Atomic Absorption Spectrometry (FAAS) has for a very long time been the instrument of choice for this type of geochemical analysis. The Agilent 4200 MP-AES is a suitable replacement for FAAS.
By introducing the 4200 MP- AES, the application range of the MP-AES has expanded to include challenging geochemical samples. This instrument features a sophisticated microwave cavity and a torch developed to handle samples with high dissolved solids with enhanced detection limits and a high working range than FAAS.
The MP-AES runs with nitrogen, eliminating hazardous and costly gases such as acetylene, improving safety and enabling unattended instrument operation even in remote areas.
This article presents base metals silver, copper, nickel, zinc and lead results for geochemical certified reference materials analyzed by the 4200 MP-AES.
Experimental - Instrumentation
All the measurements were performed using an Agilent 4200 MP-AES. For running the MP-AES, Dewar nitrogen was used.
The nitrogen generator minimizes difficulties in gas sourcing in remote locations or metropolitan areas where supply of analytical grade gases is impossible. Using an inert OneNeb Nebuliser and a double pass glass cyclonic spray chamber, orange/green pump tubing and a pump speed of 10 rpm, this setup offers a well-controlled matrix loading to the plasma without sacrificing detection limits.
The nebulizer gas flow is mass flow-controlled offering long and short term sample nebulization stability during high total dissolved solid sample analysis. The instrument operates in a rapid sequential mode and with the peltier cooled CCD detector, background and spectral interferences can be corrected very easily and precisely using MP Expert software.
Table 1 provides the method parameters.
Table 1. Method parameters used in the analysis
| Parameter |
Value |
| Nebulizer |
OneNeb |
| Nebulizer fl ow rate |
0.4 L/min |
| Spay chamber |
Double pass glass cyclonic |
| Pump rate |
10 rpm |
| Sample pump tubing |
Orange/green |
| Waste pump tubing |
Blue/blue |
| Internal standard pump tubing |
Orange/green |
| Autosampler |
Agilent SPS 3 |
| Read time |
5 seconds for Ag, 3 seconds for all others |
| Number of replicates |
3 |
| Fast pump during uptake |
On |
| Sample uptake delay |
30 seconds |
| Rinse time |
120 seconds |
| Stabilization time |
20 seconds |
| Background correction |
Auto |
| Gas source Dewar |
N2 |
Sample and Calibration Standard Preparation
Two reference materials from GeoStats Pty Ltd were analyzed to validate the method:
- GBM398-4 Low grade Cu/Pb/Zn with Laterite; and
- GBM908-14 Cu-Zn-Pb Sulphide Ore.
The sample preparation method involved digesting a HNO3-HCl-HClO4-HF four-acid with 0.4g of nominal sample weight. The mixture was taken to near dryness and after cooling, the digest was brought to a 100mL final volume with 30% HCl solution. This signifies a 250x nominal sample dilution. This four acid digestion method enables near total digestion of samples for the analysis.
The preparation of all calibration standards solutions was done in 6% HNO3 and 19% HCl.
Wavelength Selection and Background Correction
Table 2 offers the background, emission line selection and interference correction methods used. The chosen wavelengths offer the least spectral interference and a broad dynamic range eliminating re-analysis and time-consuming sample dilutions.
Using orange or green tubing, an internal standard solution of 10 mg/L lutetium was delivered and the sample tubing was connected using a Y-connector.
Since Lutetium is very rarely present in geochemical samples, it is selected as the internal standard element. The criterion for acceptance of the calibration curve is a correlation coefficient higher than 0.999, and less than 10% calibration fit error, on each standard. For all wavelengths a linear curve fit was used.
Spectral Interference Corrections
Geological samples include a broad variety of elements at differing concentration that can result in spectral interferences. Across the available wavelength range the 4200 MP-AES has continuous wavelength coverage and the MP Expert software includes an extensive wavelength database that helps to select analytical wavelengths and detect possible interferences.
A combination of Agilent Fast Linear Interference Correction (FLIC) and conventional interelement corrections (IECs) were used for the samples analyzed in this matrix. FLIC is a sophisticated and convenient background correction method that corrects spatial interferences also.
Using easy-to-use steps designed in the MP Expert software, the IEC factors were developed. This involved the use of a 1mg/L single element silver standard, and 100 and 1000ppm single element interferent standards to generate the IEC factors. In order to reflect the concentration of interferents in the samples, the concentration of interferent standards were chosen.
Table 2. Analyte line selection, background, and interference correction methods
| Element |
Wavelength (nm) |
Type |
Background Correction |
Interference Correction |
Possible Interferences |
| Ni |
305.082 |
Analyte |
Auto |
|
La |
| Ag |
328.068 |
Analyte |
Auto |
IEC |
Cu, Ti |
| Ti |
334.940 |
IEC |
Auto |
|
|
| Pb |
405.781 |
Analyte |
Auto |
|
La, Ti |
| Zn |
481.053 |
Analyte |
|
FLIC |
La, Sr, and Ti |
| Cu |
510.554 |
Analyte |
|
FLIC |
Al2O3 and La |
| Lu |
547.669 |
IS |
|
FLIC |
Ni, Ti |
For Zn, Lu and Cu, FLIC models were used for spectral interference correction. Figure 2 shows Ni and Ti interference on Lu as corrected by FLIC.
Table 3 provides the FLIC sequence matrix for running single and blank element analyte and interferent standards. In case samples have other elements creating spectral interferences on analyte lines, more IEC corrections can be generated or further FLIC models can easily be created in MP Expert.
Table 3. FLIC sequence
| Anayte (nm) |
Blank |
Analyte mg/L |
Interferent 1 Al mg/L |
Interferent 2 Ti mg/L |
Interferent 3 La mg/L |
Interferent 4 Sr mg/L |
Interferent 5 Ni mg/L |
| Zn (481.053) |
Cal Blank |
10 |
x |
100 |
100 |
100 |
x |
| Cu (510.554) |
Cal Blank |
10 |
1000 |
x |
00 |
x |
x |
| Lu (547.669) |
Cal Blank |
10 |
x |
100 |
x |
x |
100 |
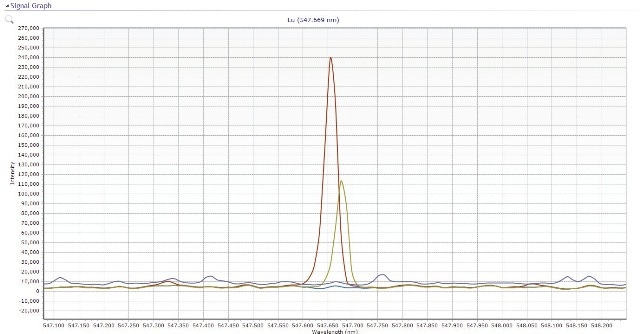
Figure 2. Ni and Ti interference on the Lu 547.669 nm line using FLIC with the blank (blue), Lu (red), Ni (green), and Ti (dark blue)
Results and Discussion
Results obtained on the MP- AES for the two reference materials are given in Table 4. By evaluating 10 replicates of acid digested method blank under method conditions, method detection limits were determined. The MP-AES results lie within ±10% of certified concentrations as seen in Table 4.
According to the results, it can be concluded that MP-AES can measure silver at low levels by using IEC to correct for spectral interferences. Elements like zinc and copper show excellent recovery across a wide concentration range (0.39% to 2.37% for Cu, and 0.51% to 4.27% for Zn) demonstrating the capability of the MP-AES to measure samples over a wide dynamic range.
Table 4. MDL and recoveries for reference materials determined by the 4200 MP-AES. All results shown for the solid sample.
| |
GBM398-4 |
GBM908-14 |
| Analyte |
Units |
MDL |
MP-AES |
Certified |
Recovery (%) |
MP-AES |
Certified |
Recovery (%) |
| Ag |
mg/kg |
1 |
45.8 |
48.7 |
94 |
298.7 |
303.7 |
98 |
| Cu |
wt % |
0.002 |
0.37 |
0.39 |
95 2 |
30 |
2.37 |
97 |
| Ni |
wt % |
0.002 |
0.39 |
0.41 |
97 |
- |
nr |
- |
| Pb |
wt % |
0.002 |
1.08 |
1.17 |
92 |
3.24 |
3.30 |
98 |
| Zn |
wt % |
0.002 |
0.50 |
0.51 |
98 |
4.24 |
4.27 |
99 |
Conclusion
The results obtained from analyzing geochemical reference materials obtained with the Agilent 4200 MP-AES show that MP-AES is a very good technique for enabling analysis of even challenging geochemical samples. The next-generation torch and waveguide create plasma capable of determining elements at ppm levels to percent levels in the sample.
The large wavelength database and continuous wavelength range enable wavelengths to be selected that minimize spectral interferences and maximize the working range. Also, spectral interferences were successfully corrected using FLIC and IEC models. The MP-AES enhances laboratory safety and offers significant reduction in running cost. Eliminating costly gases means that the MP-AES is capable of running unattended and in remote areas.
About Agilent Technologies Inc.
Agilent is the proven leader in elemental analysis for geochemistry, mining, and metals industries. We offer the broadest atomic spectroscopy portfolio on earth, with AA, MP-AES, ICP-OES and ICP-MS solutions that solve your toughest challenges.
Our innovative and unique solutions also create opportunities for you to advance and define new levels of performance. From exploration and production to mine site rehabilitation, Agilent is the single source you require to achieve rock-solid minerals analyses with maximum speed, accuracy, safety and cost savings.
MP-AES Cost Savings Estimator
Agilent Solutions for Geochemistry, Metals & Mining
- Rugged, reliable, low cost atomic absorption spectrometers ideal for challenging conditions
- Revolutionary Microwave Plasma Atomic Emission Spectrometer (MP-AES), which runs on air, enabling unattended multi-element analyses without flammable and expensive gases
- Robust, productive ICP-OES chosen by mining labs around the world for fast,
- accurate and reproducible geochemical analysis
- ICP-MS for ultimate confidence in trace analysis
- Micro GC for the analysis of mine gas
- Handheld FTIR for at-site rock and mineral measurement

This information has been sourced, reviewed and adapted from materials provided by Agilent Technologies Inc.
For more information on this source, please visit Agilent Technologies Inc.