Sponsored by PerkinElmerAug 24 2023Reviewed by Olivia Frost
This article describes a non-destructive analytical technique for quantifying the amount of respirable crystalline silica (RCS) present on sampling filters after the completion of a work shift at the specific site where the sample collection transpired.

Image Credit: ShutterStock/sichkarenko.com
The process involves capturing respirable dust from the worker's breathing zone and depositing it onto a polyvinyl chloride (PVC) filter. The level of the employee's interaction with airborne pollutants can then be calculated.
Infrared spectra are collected in transmission mode through the PVC filter and are analyzed for crystalline silica content.
Field Analysis of Silica Tool (FAST) software, developed by the United States National Institute for Occupational Safety and Health (NIOSH), is then used to store all of the relevant details in a single location regarding the analysis, including worker location and task for easy exposure monitoring.
Introduction
Silicon is the second most abundant element within the Earth's crust, comprising around 27% of the average composition of rocks.1 Crystalline silica, categorized as a class 1 human carcinogen,2 is commonly present in rocks, soil, and sand.
Activities like crushing, drilling, grinding, masonry, concrete work, sandblasting, and mining involving silica-rich materials yield respirable crystalline silica (RCS) dust. This dust fraction pertains to the subset of inhaled particles that traverses into the gas exchange region of the lungs.3
Studies have consistently established a link between occupational exposure to RCS dust and a range of adverse health outcomes, such as silicosis, lung cancer, pulmonary tuberculosis, and chronic obstructive pulmonary disease.4
The spectrum of health effects extends even further to auto-immune diseases, including scleroderma, rheumatoid arthritis, and systemic lupus erythematosus, all correlated with RCS dust exposure.5
Silicosis, an irreversible chronic fibrotic lung disease, stems exclusively from the inhalation of RCS dust. It can cause scarring of lung tissue, deterioration in lung function, and eventual respiratory failure.6,7 Thus, to prevent silicosis, diligent exposure control measures are a must.8
To effectively control exposure to RCS, employers must ensure that air- and health monitoring is conducted routinely through sustainable methods. Legislative requirements pertaining to occupation exposure limits and monitoring of silica emphasize the importance of exposure control.9
When it comes to RCS exposure control, samples need to be collected from workers' breathing zones throughout their work shifts.10,11 To gather these samples, a diverse range of personal dust monitors, which utilize a pump to channel air from the breathing zone through a PVC filter, are needed.
The PVC filter efficiently traps the dust particles present in the sampled air, facilitating subsequent analysis. Figure 1 illustrates a variety of sampling cassettes housing the PVC filters, exemplifying the practical implementation of this approach.
Following the collection of PVC filters during a worker's shift, these filters are subsequently subjected to analysis.
The analysis takes place once at least 80% of the shift has been sampled. In instances where the analysis of sample filters reveals an excessive presence of RCS beyond permissible levels, an investigation into overexposure becomes imperative.
Work environments, particularly within the mining sector, are highly dynamic and are constantly moving into new and often different geological strata with varying silica levels. Traditional analysis methods currently employed may present a time lag before exposure data is received.
As such, the information is often useless when it comes to making decisions regarding workplace conditions aimed at preventing overexposures.
Traditional methods of RCS filter analysis can be expensive and labor-intensive. Turnaround times for results can range from a few days up to several weeks, depending on location and analysis method. The turnaround time is also limited by the distance between the sampling site and the laboratory, transport arrangements to the site, as well as the workload of the specific laboratory.
Mining sites located in remote areas also need to send samples to a significantly distanced geographic location or even a different country due to the unavailability of appropriate laboratory facilities.
FT-IR KBr Pellet
Traditionally, the analysis of filters involves the application of either Fourier Transform Infrared Spectroscopy (FT-IR) or X-Ray diffraction (XRD) techniques. Various established methods, such as NIOSH Method 7602 and MDHS101/2, have been formulated by regulatory authorities for RCS analysis.12,13
NIOSH Method 7602 is a destructive methodology involving the incineration of the PVC filter and subsequent compaction to form a potassium bromide (KBr) pellet from the residual material. The quality of the pellet is influenced by the quantity of the sample, as the ashed filter material is combined with the halide salt (KBr).
Thorough mixing of the sample with KBr powder is vital to ensure the resultant KBr pellet supports accurate spectral acquisition. The overall caliber of a pellet hinges on the quality of the KBr powder employed, which must adhere to analytical grade purity standards.
FT-IR is the chosen analytical tool for evaluating these pellets, and quantification is achieved through the creation of a calibration curve utilizing meticulously prepared standard reference materials.
X-Ray Diffraction (XRD)
XRD enables the direct analysis of respirable dust samples on filters by placing the filter within the path of the instrument's beam. Peaks in XRD patterns arise from the constructive interference of a monochromatic X-Ray beam, which scatters at precise angles from distinct sets of lattice planes present in the sample.
The intensities of these peaks are dictated by the distribution of atoms within the lattice structure. Consequently, the XRD pattern serves as a unique representation of the atomic arrangements within a given material. Calibration curves for determining the content of RCS are established using standard reference materials (SRMs).
In the DoF XRD method, a filter is positioned within sample holders integrated into the X-Ray diffractometer. Depending on the instrument's type and model, a mechanism systematically picks up individual samples for subsequent analysis.
FT-IR Direct on Filter (DoF)
The FT-IR Direct on Filter (DoF) method, outlined in MDHS101/2, was specifically devised to quantify RCS in samples collected using a Higgins-Dewell design type cyclone and is suitable for analyzing filters with a diameter of 25 mm or smaller.14
This technique is unsuited for analyzing samples collected for short-term exposure measurements (15 minutes).
FT-IR At-Site EoS DoF
The proposed At-Site End-of-Shift (EoS) Direct on Filter (DoF) FT-IR FAST method deviates from the MDHS101/2 DoF FT-IR method by offering distinct capabilities.15 The FT-IR analysis is executed using the PerkinElmer Spectrum Two™ FT-IR spectrometer (Figure 2).
The At-Site EoS DoF FT-IR method exhibits versatility in accommodating various filter sizes, sampling durations, and sample types. Furthermore, the FAST software delivers easily interpretable outcomes systematically organized within a comprehensive database.
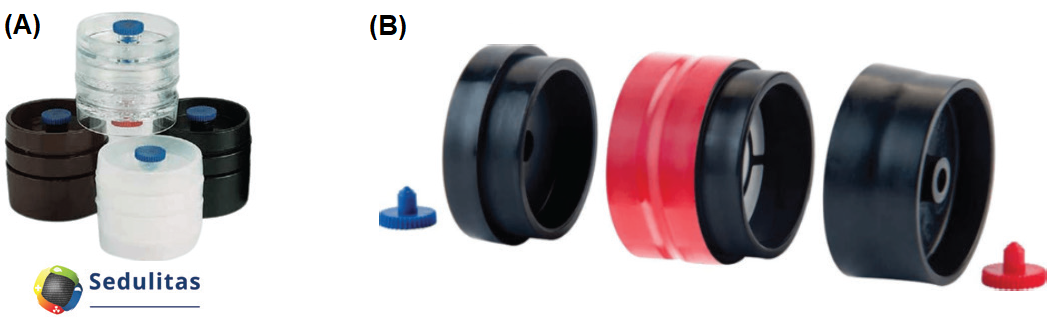
Figure 1. Representation of a standard 3-piece sampling cassettes from Sedulitas (A). Representation of the 4-piece “shoot through” sampling cassettes (B). Image Credit: PerkinElmer
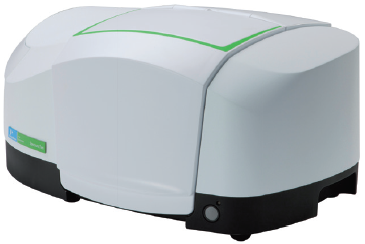
Figure 2. PerkinElmer Spectrum Two™ FT-IR Spectrometer. Image Credit: PerkinElmer
The At-Site EoS DoF FT-IR analytical method sequence diagram (Figure 3) offers a simplified representation of its operational process.
When an RCS exposure hazard is identified within a workplace, quantifying the level of exposure involves capturing a personal exposure sample through a constant velocity flow pump. Subsequently, this sample can be subjected to on-site analysis using the At-Site EoS DoF FT-IR method, either after the shift or the following day.
The results can then be assessed to ascertain whether the measured exposure values align with the acceptable limits stipulated by relevant regulations. If indications from the At-Site EoS DoF FT-IR method suggest an overexposure, appropriate investigations can be promptly undertaken.
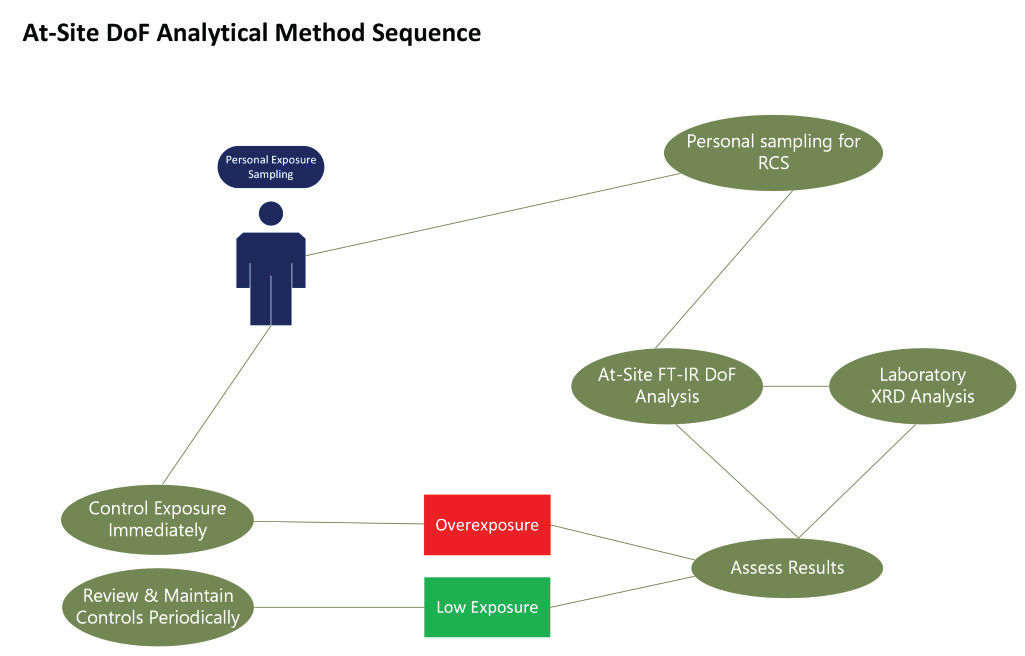
Figure 3. Flow diagram indicating the At-site DoF method process. Image Credit: PerkinElmer
This method is also ideally suited for periodic assessments of control measures. A sample can be collected within a designated area and subsequently analyzed through the At-Site EoS DoF FT-IR method. The results obtained offer insights into the efficacy of current control measures in either mitigating or diminishing RCS exposure.
The At-Site EoS DoF FT-IR analytical method has been specifically designed for respirable alpha quartz, which is the most common crystalline silica polymorph.
Experimental
Sample Preparation
Sampling media were prepared using an analytical microbalance, adhering to established protocols for the collection and gravimetric analysis of respirable, thoracic, and inhalable aerosols. These methodologies are defined in MDHS14/4, a directive released by the Health and Safety Laboratory of the Health and Safety Executive (HSE), UK.
Filters were weighed and subsequently placed into assigned sampling cassettes. The cassettes' exteriors were marked to denote the initial filter weight and dimensions before being enclosed.
For this data collection trial, 37 mm diameter PVC filters were utilized alongside a 4-piece sampling cassette, a cyclone, and a personal sampling pump adjusted to an average flow rate of 2.2 L/minute. On the designated data collection day, a prepared sampling cassette was affixed to a cyclone and connected to a personal sampling pump.
Workers wore the sampling apparatus for a minimum of 7 hours (roughly 80% of their shift). After the data collection interval, the sampling cassettes were disengaged, and particulars concerning the nature of work and workers' on-site location were documented.
Figure 4 shows examples of PVC filters following a data collection event. Data collection was conducted over a total of 17 days, spanning 2 months, at an opencast iron ore mine located in South Africa.
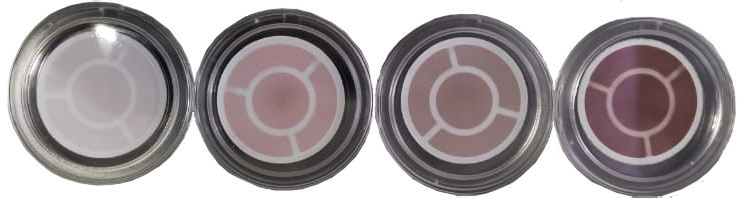
Figure 4. 37 mm PVC filters post data collection event. Image Credit: PerkinElmer
Analysis Method
50 PVC filters were employed for monitoring the air conditions within workers' breathing zones throughout the data collection operation. Gravimetric analysis, adhering to MDHS 14/4, was executed on all filters to gauge the cumulative mass of respirable dust that workers encountered during their shifts.
Dedicated sample holders tailored to the filter size and cassette used for air sampling were employed to secure the PVC filters within the sample compartment of a PerkinElmer Spectrum Two FT-IR. Background and sample spectra were acquired according to the data collection parameters stipulated in Table 1.
After every five samples, background spectra were acquired using a fresh, unused PVC filter sourced from the same batch as those employed for workers' air monitoring. Sample spectra were normalized to the background spectra of the pristine PVC filters, generating absorbance spectra.
Post FT-IR analysis, all sample filters were dispatched to a third-party laboratory for reference measurements conducted through Method MDHS101/2 and NIOSH 7602, utilizing X-Ray Diffraction (XRD) methodologies, respectively.
An adjustment factor tailored to the specific site was established using eight out of the total fifty filter samples. This adjustment factor was calculated using the FAST Mine-Specific Adjustment Tool incorporated within the NIOSH-developed FAST software.
The derivation of this factor was achieved through inverse linear regression analysis, effectively compensating for the impact of mineral interferents and their influence on the infrared spectrum.
For the remaining 42 samples, which were not involved in deriving the site-specific adjustment factor, calculations were conducted to determine peak areas within the acquired sample spectra.
These calculations were facilitated by an automated data analysis macro. Comprehensive details of the peak areas and corresponding baseline parameters are documented in Table 2.
The calculated peak areas, along with sample specifics such as pump flow rate, cyclone type, and flow duration, were entered into the FAST software.
This facilitated the computation of silica mass concentration for each sample. The outcome provided by the FAST software presents the quantified mass of RCS in micrograms and the RCS concentration expressed in micrograms per cubic meter (µg/m³).
Table 1. Instrument parameters used for data acquisition of samples analyzed using the At-Site EoS DoF FT-IR method for the monitoring of respirable dust samples. Source: PerkinElmer
| Parameter |
Value and Unit |
| Resolution |
4 cm-1 |
| Number of Scans |
16 |
| Spectral range |
4000 – 400 cm-1 |
| Phase correction |
Mertz |
| Apodization |
Strong |
Table 2. Peak area calculations for components within the respirable dust samples to be imported to the FAST software. Source: PerkinElmer
| Component |
Left Limit (cm-1) |
Right Limit (cm-1) |
Base 1 (cm-1) |
Base 2 (cm-1) |
| Silica |
816 |
767 |
816 |
767 |
| Kaolin |
930 |
900 |
930 |
900 |
Results and Discussion
Spectral characteristics around 800 cm-1 and 780 cm-1 correspond to the Si-O-Si symmetric stretching vibration inherent to quartz. These features serve as valuable tools in quantitatively assessing RCS within air monitoring samples.
Kaolin, a soft white clay, is an important interferent marked by an absorption feature at approximately 790 cm-1. When it comes to analysis, the presence of kaolin in the sample matrix necessitates careful consideration. Figure 5 illustrates the distinct pure component spectra of quartz and kaolin, highlighting the contrast between these two substances.
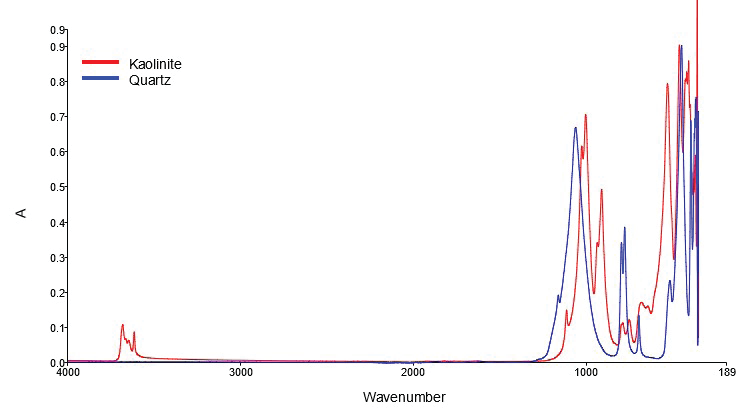
Figure 5. Pure component spectra for quartz and kaolin. Image Credit: PerkinElmer
The DoF XRD outcomes, obtained through an external laboratory aligned with the MDHS101/2 procedure, demonstrated that 32 out of the 50 PVC samples exhibited RCS content below the detection threshold.
The detection limit (LOD) established by the reference laboratory was noted as 30 µg for the 37 mm PVC filters employed in this study. Due to the notably low concentration of respirable silica in these samples, they were excluded from subsequent analysis.
The remaining 18 samples, where XRD values surpassed the LOD, were further utilized to compare the At-Site EoS DoF FT-IR analysis method with those ascertained through XRD. Figure 6 illustrates the comparison of RCS concentration determined by the MDHS101/2 method and the At-Site EoS DoF FT-IR methods.
A Spearman correlation coefficient of r = 0.84 indicates a moderately strong agreement between the FT-IR and XRD values for RCS exposure.
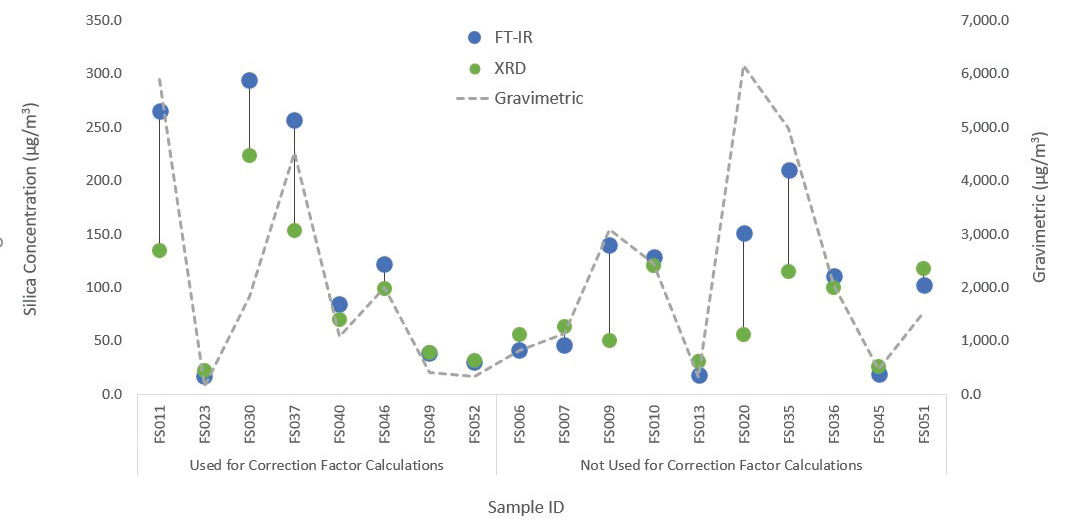
Figure 6. Line chart showing comparison between reference XRD and At-Site EoS DoF FT-IR values for RCS content. Image Credit: PerkinElmer
The notable disparities observed in the projected RCS concentrations for several samples can be attributed to elevated dust loadings on the PVC filters. The cumulative respirable dust for all collected samples was gauged utilizing the MDHS14/4 technique.
A robust association is evident, substantiated by a high Pearson correlation coefficient (R2 = 0.90), between the overall dust loading and the variance in silica concentration established through the At-Site EoS DoF FT-IR method in comparison to the MDHS101/2 method relying on XRD.
This substantial correlation between dust loading and the disparity in estimated silica concentration values is depicted in the form of a graph in Figure 6.
The site-specific correction factor was established using the FAST software for 8 of the 50 samples. This factor was then employed to predict the RCS concentrations for the remaining samples, where XRD reference values exceeded the detection limit.
Figure 6 displays a correlation plot depicting the relationship between the reference XRD values and the RCS concentrations determined using the At-Site EoS DoF FT-IR method.
Application of the site-specific correction factor leads to an improvement in the correlation coefficient, raising it from 0.84 to 0.95 for uncorrected and corrected RCS mass concentrations. This enhancement signifies an excellent level of agreement between the values post-correction.
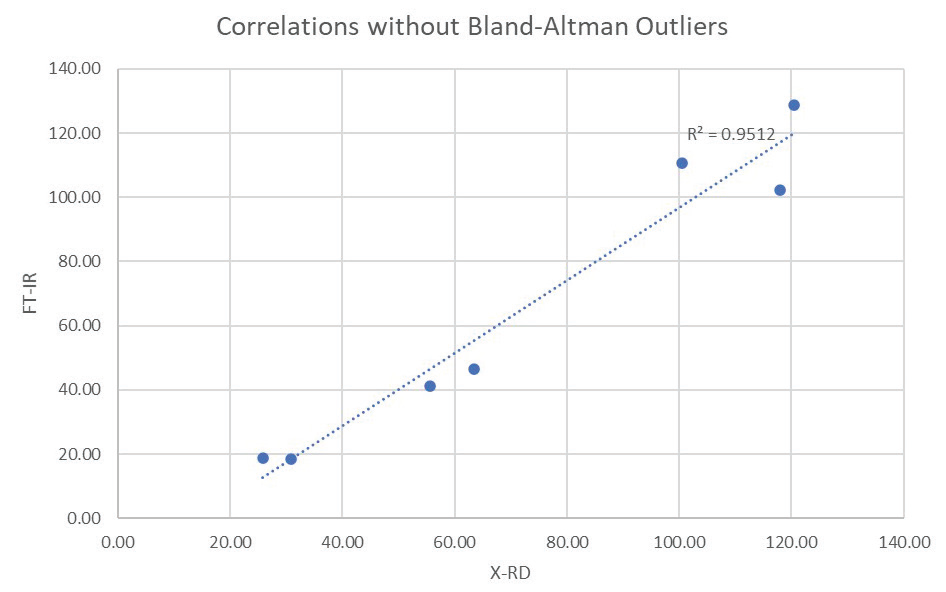
Figure 7. Correlation plot showing the agreement between the reference XRD value and silica concentration determined by the At-Site EoS DoF FAST method following application of a site-specific correction factor. Image Credit: PerkinElmer
In conjunction with the reference measurements carried out via XRD as per MDHS101/2, additional reference measurements were undertaken using NIOSH 7602 through FT-IR, involving the analysis of a KBr pellet.
Figure 8 presents a comparison chart for the seven samples that remained after applying the site-specific correction factor.
The chart illustrates the outcomes of the three measurement techniques. These techniques exhibit similar trends across the data points, highlighting the effectiveness of the At-Site EoS DoF FAST method for RCS dust monitoring.
It is vital to emphasize that while the At-Site EoS DoF FAST method is valuable for analyzing respirable dust samples, it does not fully replace the need for reference samples analyzed via established methods.
This method complements existing International Organization for Standardization (ISO) accredited analysis methods. Around 20% of all samples should be validated by an ISO 17025-accredited laboratory.
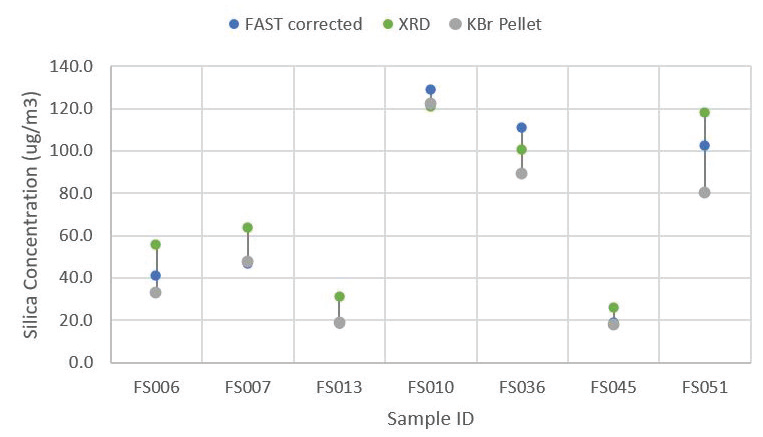
Figure 8. Chart comparing the three measurement techniques: At-Site EoS DoF FAST, XRD following MDHS101/2 and FTIR KBr pellet according to NIOSH 7602. Image Credit: PerkinElmer
Summary
At-Site EoS DoF FT-IR analysis for RCS provides industrial and occupational hygienists with the capacity to respond promptly to potential overexposures, enabling accurate exposure event record-keeping.
This contrasts with third-party laboratories, which often entail extended turnaround times, hindering overexposure investigations.
The combination of At-Site EoS DoF FT-IR analysis for RCS and the FAST software offers users a precise solution, enabling swift on-site RCS quantification. This eliminates the delays linked to off-site analysis.
Timely information empowers employers to proactively manage exposure risks to RCS in the workplace, allowing swift action as risks emerge.
The FAST software serves multiple functions. It calculates silica levels in the sample filter, determines the corresponding exposure level, and serves as a central repository for vital information. This includes worker and location details, worker tasks during sampling events, and sampling media specifics.
FAST data can be swiftly shared across devices, equipping industrial/occupational hygienists with the necessary tools to address RCS dust overexposures and prevent future occurrences.
Numerous studies affirm FT-IR's efficacy in estimating RCS exposure using the EoS DoF method. The PerkinElmer Spectrum Two ensures precision and reproducibility for accurate DoF analysis results from respirable dust samples.
References
- The Editors of Encyclopeadia Britannica. 2018. Silicon (Si). In Britannica academic. https://academic-eb-com.nwulib.nwu. ac.za/levels/collegiate/article/silicon/67764
- The International Agency for Research on Cancer (IARC). 2005. MONOGRAPHS ON THE EVALUATION OF CARCINOGENIC CRYSTALLINE SILICA. Silica Dust, Crystalline, in the form of Quartz or Cristobalite.
- UNITED STATES DEPARTMENT OF LABOR. 2021. Silica, Crystalline. https://www.osha.gov/silica-crystalline
- Rees, D. & Murray, J. 2007. Silica, silicosis, and tuberculosis. The International Journal of Tuberculosis and Lung Disease. 11: 474-484.
- Parks, C.G., Conrad, K., & Cooper, G.S. 1999. Occupational exposure to crystalline silica and autoimmune disease. Environ Health Perspective Journal. 107(5):793-802. doi: 10.1289/ehp.99107s5793
- American Lung Association. 2020. Learn about Silicosis. https://www.lung.org/lung-health-diseases/lung-disease-lookup/silicosis/learn-about-silicosis
- NHS. 2018. Silicosis. https://www.nhs.uk/conditions/silicosis/
- National Institute for Occupational Safety and Health (NIOSH). 2021. A Guide to safely working with Silica. https://www.cdc. gov/niosh/pdfs/silicax.pdf
- Safesite. 2020. Silica dust exposure. https://safesitehq.com/ osha-silica/
- Optimum Safety Management. Hierarchy of Controls – Respiratory Protection. https://www. optimumsafetymanagement.com/blog/hierarchy-ofcontrols-respiratory-protection/
- The Center for Construction Research and Training. Work safely with silica. https://www.silica-safe.org/plan/option-2- perform-air-monitoring
- NIOSH Manual of Analytical Methods (NMAM). 5th Ed. SILICA, Respirable Crystalline, by IR (KBr pellet) 7602. 2017. Issue 4: 667-673. https://www.cdc.gov/niosh/nmam/ pdf/7602.pdf
- Health and Safety Executive (HSE). Crystalline silica in respirable airborne dust. 2014. MDHS101/2. https://www. hse.gov.uk/pubns/mdhs/pdfs/mdhs101.pdf
- L.G., Chubb & E.G. Cauda. Direct-on-filter Analysis for Respirable Crystalline Silica Using a Portable FT-IR Instrument. U.S. Department of Health and Human Services (DHHS), Centers for Disease Control and Prevention (CDC), National Institute for Occupational Safety and Health (NIOSH).
- EoS FT-IR User Guide. 2018. Field-based Silica Monitoring User Guide.

This information has been sourced, reviewed and adapted from materials provided by PerkinElmer.
For more information on this source, please visit PerkinElmer.