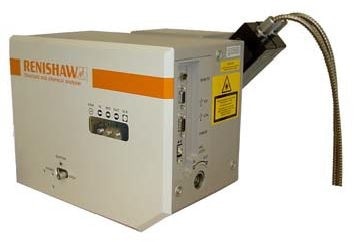
Figure 1 displays the Renishaw structural and chemical analyser (SCA). This enables mineralogists and geologists to benefit from the analytical and imaging capabilities of scanning electron microscopes (SEMs) whilst also combining the structural and chemical characterisation provided by Raman spectroscopy.
The SEM-Raman system enables elemental analysis and rapid observation at both micro and macro scales.
Geologists hope to understand the Earth’s origin and the processes which have shaped and continue to shape it by studying the minerals within rocks. For them, the past can be seen as the key to an understanding of the present.
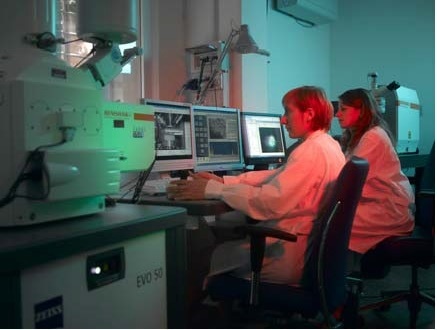
Figure 1. The SEM-SCA at Bologna University - Italy
For a number of years, the principal tool mineralogists and geologists have used has been the petrographic microscope. This can reveal a great deal about a given sample, however it can only do so if it transmits light.
Other methods such as mass spectrometry and x-ray crystallography are required in order to study opaque minerals. Increasingly, SEMs which have been fitted with energy dispersive x-ray analysis systems (EDS) are being used. However, often instruments which have been fitted with wavelength dispersive X-ray (WDS) analysers are unable to unambiguously identify chemicals.
Raman spectroscopy works by measuring molecular bonds’ vibrational frequencies in an analysed material. The Raman spectrum which results is both sensitive to the local environment and unique for a given compound. This means that structural data can also be revealed by these spectra.
A laser spot is used as the excitation source during Raman spectroscopy. This analysis is non-destructive, and is not affected by the vacuum condition. A spatial resolution which is comparable to that of EDS analysis is guaranteed by the fact that the laser spot’s size is in the order of one micrometre.
SEM-Raman Investigation of Sandstone from Loch Torridon
Formed from rocks which predate life, Loch Torridon’s sandstone deposits – located in North-West Scotland – are some of the oldest in Europe.
Both opaque and transparent components were observed in a standard geological thin section which was taken from the sample (Figure 2). Identifying the components of this sample – which is typical of alluvial deposits – can give insight into the origins of the host strata as well as the sedimentation process.
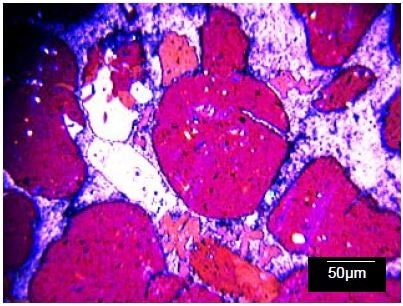
Figure 2. Optical micrograph of typical part of the sandstone
As the sample was non-conductive and uncoated, it was examined with the use of the low vacuum (LV) mode in order to avoid charging artefacts in the SEM images.
In these conditions, differences in the components’ mean atomic number leads to a contrast in the image. If a component appears brighter, it has a higher mean atomic number. The area which was selected for investigation with the use of x-ray and Raman spectroscopies is displayed in Figure 3.
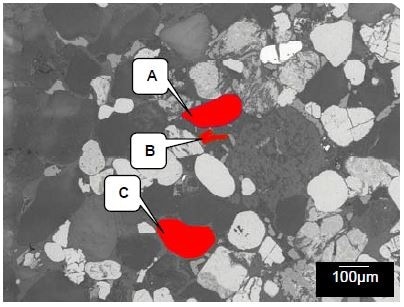
Figure 3. LV-SEM image showing the image used for x-ray mapping and the areas from which Raman spectra were collected
In order to reveal the spatial distribution of the sample’s elements, x-ray maps were taken from the area shown in Figure 3. Even though it is possible to quantify the data, this may not identify hydroxides and oxides reliably. It is also unable to discriminate between the different crystalline forms of the minerals in the sample.
In Figure 4, the titanium, iron, and potassium x-ray maps which were collected from the area displayed in Figure 3 are shown. These are displayed in green, red, and blue respectively. The x-ray maps formed a guide which helped select regions of interest from which the Raman spectra could be selected.
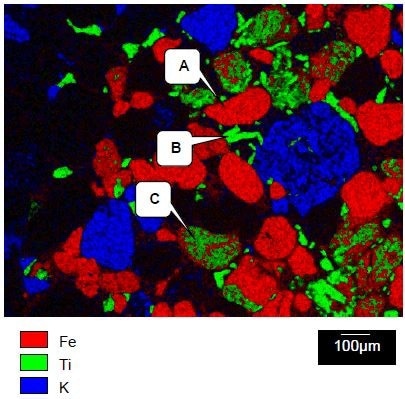
Figure 4. Iron, titanium, and potassium x-ray maps collected from the area shown in Figure 4
Figures 5, 6, and 7 display the Raman spectra collected from regions A, B, and C respectively. Raman spectroscopy identifies region A as haematite (Fe2O3) with the use of the Renishaw database of minerals.
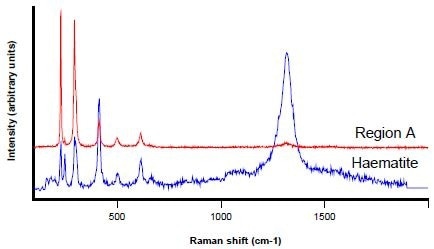
Figure 5. Raman spectrum from Region A (red) and a haematite reference spectrum (blue)
In a similar manner, region B is revealed to be anatase – a polymorph of titanium dioxide (TiO2).
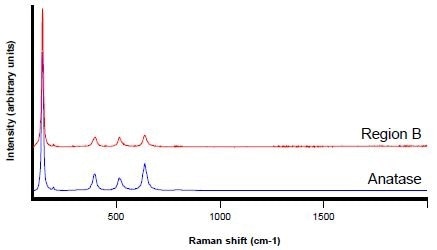
Figure 6. Raman spectra from Region B (red) and an anatase reference spectrum (blue)
Displayed in blue in Figure 7, the spectrum from Region C is similar to haematite (the red in Figure 7), although it is generally less well defined. There is an additional band at 436 cm-1 and the peaks are less intense and broader.
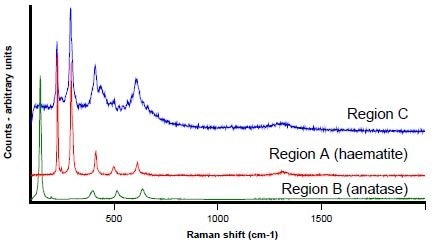
Figure 7. Raman spectra from Regions A (red) B (green) and C (blue)
Titanium is generally considered to be substituting for iron in the haematite matrix, which is consistent with the x-ray data and may account for the side band at 436 cm-1
As the extremely intense and characteristic anatase Raman bands (the green spectrum shown in Figure 7) are absent, the titanium is not present as anatase. Further to this, the bands do not match ilmenite (FeTiO3 – not shown).
The theory of matrix disruption is further supported by the peak broadening, which is characteristic of poor crystallinity. An extended and complex deposition process is implied by this incorporation of titanium within the haematite matrix.
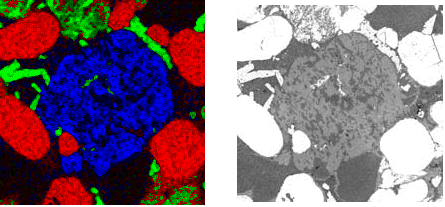
Figure 8. Potassium x-ray map (blue) from the region shown right
As shown in the LV-SEM BE image, the sizeable grey region displayed in Figure 8 is comprised of two distinct phases. In the white light image, these were not visible. The sole difference between the phases which was indicated by x-ray mapping was the amount of potassium which was present.
The high spatial resolution of the SCA enables spectra to be collected from the phase domains, even though they are relatively small (usually less than 10 micrometres). As seen in Figure 9, clear spectral differences between the dark and light areas were exhibited by these analyses.
Both regions were identified as types of feldspar through comparisons of the data with library spectra. The lighter regions were specifically classified as alkali feldspar, while the darker ones were classified as plagioclase feldspar. These results were consistent with the x-ray data.
Comparison of the data with library spectra identified both regions as types of feldspar. The darker regions were specifically classified as plagioclase feldspar, and the lighter ones as alkali feldspar – this is consistent with the x-ray data.
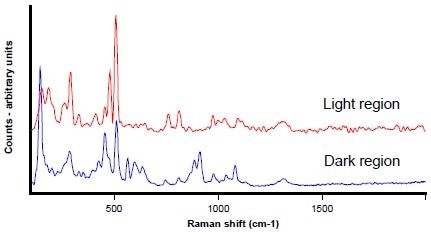
Figure 9. Raman spectra from the dark (blue) and light regions (red)
Rapid cooling of the parent igneous rock is indicated by the exsolution structure noted in the feldspar.
The combination of SEM imaging and EDS analysis with Raman spectroscopy in this example has enabled the full characterisation of the minerals and their phases. Solely using optical microscopy would not have enabled these results, as the opaque minerals cannot be identified.
X-ray analysis alone would have similarly produced a result which was misleading for the titanium-substituted haematite. This test would not have identified the feldspar chemistry or the titanium dioxide polymorph.
X-ray mapping, however, is an effective technique for locating regions of interest, and identifying the elements present within them. This data can assist greatly with interpretation of the Raman spectra, which can be very sensitive to subtle chemical and structural differences.
Advantages of SEM-SCA in Geology and Mineralogy
- Whilst EDS solely identifies the elements present, Raman determines the chemical composition
- Whilst EDS cannot distinguish between polymorphs such as crystobalite and rutile, Raman can
- The SEM spot size and laser enable improved spatial resolution when compared to optical petrography
- The spatial context can be maintained as Raman analysis can be carried out in situ
- Raman spectroscopy and EDS analysis complement each other as they reveal subtle variations in the composition as well as the presence of trace elements
- No additional preparation is required to view standard thin sections, which permits their re-use by optical petrography
- It is possible to simply and rapidly carry out the full characterisation of opaque and economic minerals

This information has been sourced, reviewed and adapted from materials provided by Renishaw plc.
For more information on this source, please visit Renishaw plc.