The Renishaw structural and chemical analyser (SCA) enables mineralogists and geologists to benefit from the analytical and imaging capabilities of scanning electron microscopes (SEMs) whilst also combining the structural and chemical characterisation provided by Raman spectroscopy.
The SEM-Raman system enables elemental analysis and rapid observation at both micro and macro scales.
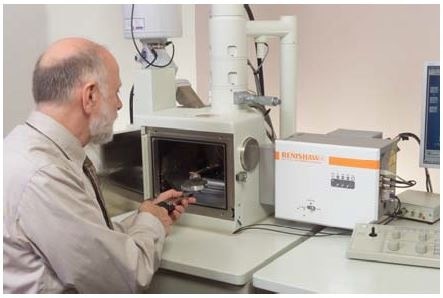
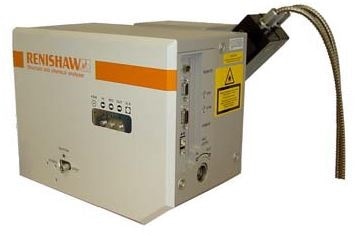
The SEM-SCA at McCrone Associates Inc – Westmont, IL
Raman spectroscopy works by measuring molecular bonds’ vibrational frequencies in an analyzed material. The Raman spectrum which results is both sensitive to the local environment and unique for a given compound. This means that structural data can also be revealed by these spectra.
A laser spot is used as the excitation source during Raman spectroscopy. This analysis is non-destructive, and is not affected by the vacuum condition. A spatial resolution which is comparable to that of EDS analysis is guaranteed by the fact that the laser spot’s size is in the order of one micrometer.

SEM-Raman Investigation of OPC (Ordinary Portland Cement) Clinker
Cement is a vital structural material. Even though it is manufactured on an industrial scale, an understanding of its basic chemistry can help to understand its properties and predict its behaviour.
Limestone and clay are roasted in rotary kilns at roughly 1400 ºC in order to produce “clinker” nodules which are subsequently ground into a powder which we call cement. There are four chief components of cement which influence its strength as well as its hydration (a measurement of how rapidly it “sets”).
C3S (alite) 50% to 75% rapid hydrating, high strength
C2S (belite) 15% to 30% slow hydrating, high strength
C3A 5% to 10% rapid hydrating, low strength
C4AF 5% to 15% slow hydrating, low strength
C = CaO, S = SiO2, A = Al2O3, F = Fe2O3
Fluorescence usually prevents Raman analysis being conducted on cement powder1,2, but as clinker does not fluoresce, the components within it can be identified.
On a polished nodule of Rugby OPC (Ordinary Portland Cement) clinker, observations were carried out using Raman spectroscopy, x-ray analysis, and SEM. As the sample is non-conductive, the SEM was used in low vacuum (LV) mode in order to avoid charging artefacts.
The collection of backscattered electrons which have been emitted from the surface during LV-SEM forms the image. The mean atomic number of the sample determines the number of incident electrons which are backscattered from the surface – lighter areas are less dense than darker ones.
Shown in Figure 1 is an LV-SEM image containing a region (boxed) in which dark globular inclusions exist in a light matrix. Raman spectra (Figure 2) were collected from a light region (in red), and from a dark one (in blue).
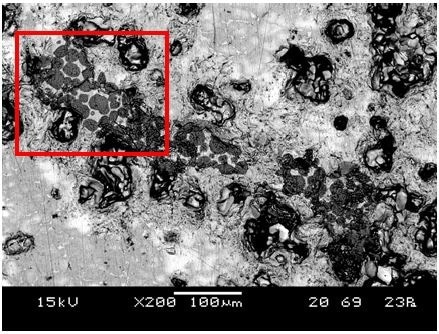
Figure 1. LV-SEM image showing region from which Raman spectra were collected
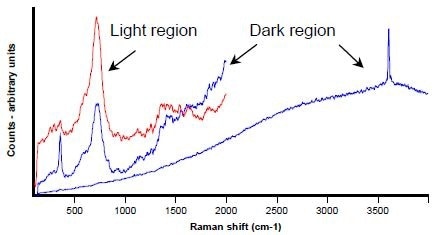
Figure 2. Raman spectra from dark (in blue) and light (in red) areas shown in Figure 1
In the light region, the spectrum’s broad band is usually attributed to the presence of small amounts of iron-bearing interstitial phases (not magnetite (Fe3O4) or haematite (Fe2O3)). However, there could be no unambiguous identification of the phase.
The interstitial iron band is also contained within the spectra from the dark region, however the other bands are characteristic of portlandite – Ca(OH)2. As hydrated phases would not normally be expected in clinker, this constitutes an unexpected finding. However, this is probably due to the hydration of free lime (CaO) during sample preparation, as Taylor reports.3
An LV-SEM image from another region is shown in Figure 3. A grain boundary precipitate as well as compositional variations within the grains themselves is clearly identified by the atomic number contrast. In the white-light image, these variations are not visible.
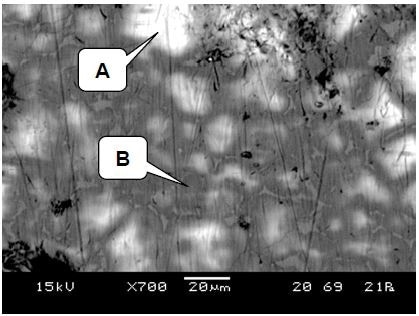
Figure 3. LV-SEM image showing light and dark regions in the clinker matrix, and the presence of grain boundary precipitates. Raman spectra were collected from points A and B
X-ray mapping (see Figure 4) indicates that although aluminum is confined to the grain boundaries, and silicon is confined to the grains, oxygen and calcium are ubiquitous. Although not continuously, iron is also located in the grain boundaries.
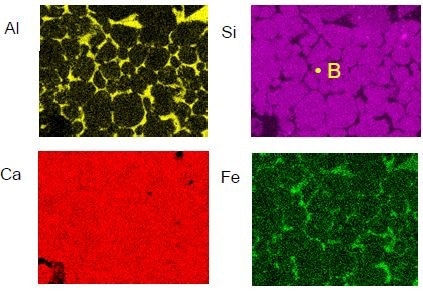
Figure 4. X-ray maps from the region shown in figure 3
Shown in Figure 3, X-ray analysis of the brighter region A indicated that the matrix predominantly comprised of oxygen, silicon, and calcium. The Raman spectrum which was collected from point A (displayed as the red spectrum in Figure 5) strongly correlated with a monoclinic C3S standard (shown in blue). It is clear therefore that the bright regions are alite – (CaO)3.

Figure 5. Raman spectrum collected from point A (Figure 3) in red, with alite reference - (CaO)3.SiO2 – in blue
X-ray analysis indicated that the darker areas (region B) also comprised of oxygen, silicon, and calcium, however they contained more calcium when compared to the bright regions. Shown in Figure 6, the Raman spectrum which was collected from point B (which is shown in red) strongly correlated with a C2S standard (which is shown in blue). Consequently, the darker regions are identified as belite – (CaO)2.SiO2.

Figure 6. Raman spectrum collected from point B (Figure 3) in red, with belite reference - (CaO)2.SiO2 – in blue
In the SEM image, the subtle variations in the sample’s composition are shown by backscattered electron imaging. These changes cannot be seen with the use of optical microscopy. Further to this, unlike optical microscopy, SEM imaging is not sensitive to surface flatness or roughness.
The sample components’ spatial relationships are confirmed by x-ray mapping – the C3AF and C4AF phases seem to be present as intergranular precipitates. Theses components’ relative concentrations are able to be estimated courtesy of image analysis of the x-ray maps.
Image analysis can reveal the relative concentrations of belite and alite, just as Raman analysis of the grains confirms their identity. A new method for the characterisation of clinker both at a macro and micro scale is therefore provided by the SEM-Raman system.
References
- C-S. Deng, et al, J. Mater. Chem., 2002, 12, 3105.
- S.S. Potgieter-Vermaak, et al, Cem. Conc. Res. 2006, 36, 663.
- H.F.W.Taylor, Cement Chemistry, 2nd Ed., Thomas Telford, 1997
SEM-Raman Investigation of a Meteorite
Frequently the remnants of the original material from which our sun and the planets were formed, meteorites are amongst the oldest objects in our solar system. Consequently, unique insight can be gained from a study of meteorites’ compositions in terms of the processes involved in the forming of planetary systems.
Analysis of a meteorite from the William Mikuska collection was carried out at McCrone Associates Inc. Westmont, Illinois using their SEM-SCA.
In order to make sure that the contrast in the images came mainly from variations in mean atomic number, the SEM images shown in Figure 7 were gathered when using the SEM in low-vacuum mode. The grain structure of the iron matrix is revealed by these images, which also identify the inclusions of lower atomic numbers within it.
Figure 8 displays energy dispersive x-ray analysis observations which confirm that the matric is iron. This also shows that the darker regions contain oxygen, silicon, and magnesium. Confidence in the characterisation of the inorganic phases can only able to be achieved if their composition is known in advance, even though the EDS data can be quantified.
As shown in Figure 9, the phases can be unambiguously identified as forsterite (Mg2SiO4) and enstatite (Mg2Si2O6) using in-situ Raman spectroscopy. Despite the similarity in composition of the magnesium silicates, the Raman spectra from the different areas are clearly greatly varied.
Areas of interest can be located easily and quickly using x-ray analysis and SEM imaging. The composition can be indicated using x-ray analysis, after which Raman analysis can unambiguously identify the phases.
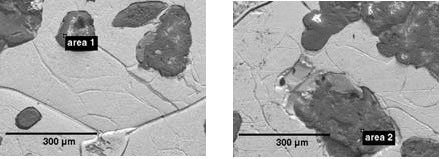
Figure 7. SEM images showing inorganic regions within an iron matrix, and the areas analyzed by EDS and Raman spectroscopy
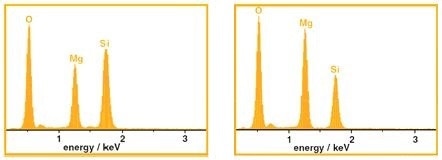
Figure 8. X-ray analysis from the regions indicated in Figure 7
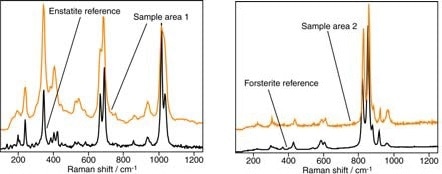
Figure 9. Raman analyses (in orange) from the regions indicated in Figure 7 and library reference spectra (in black)
Advantages of SEM-SCA in Geology and Mineralogy
- Minimal preparation is required in order to view samples which enables them to be analysed using other methods
- Fast and simple characterisation of mineral mixtures can be carried out
- Whilst EDS solely identifies the elements present, Raman determines the chemical composition
- Raman spectroscopy and EDS analysis complement each other as they reveal subtle variations in the composition as well as the presence of trace elements
- Whilst EDS cannot distinguish between polymorphs such as crystobalite and rutile, Raman can
- The spatial context can be maintained as Raman analysis is able to be carried out in situ

This information has been sourced, reviewed and adapted from materials provided by Renishaw plc.
For more information on this source, please visit Renishaw plc.