Boron (B) is an element of interest in many scenarios, particularly for its isotope ratio composition in a range of geochemical, nuclear, paleoproxy, medical and archeological applications.
Boron offers two stable isotopes, 10B and 11B, the latter of which being four times more common. An earlier IUPAC report provided a fixed value (80.1% 11B) for the representative isotopic composition of boron,1 however, the current edition of the report quotes a natural abundance range of 79.6 – 81.1% 11B.2
For purely practical purposes, the earlier presented value is reserved for situations where isotope composition is unknown.
Boron isotope ratios found in nature can vary by around 100‰ (parts per thousand, or permil) or 10%3 when expressed as the ratio of the deviation of the sample 11B/10B against an appropriate certified reference standard. The main reference standard utilized in these cases is NIST 9514, with an 11B abundance of 80.17%.
Some more specialist applications may necessitate the measurement of wider ratios than those found in nature. For example, 10B enriched boron is used in a range of nuclear and medical applications5 while 10B depleted boron is employed as a special impurity in Si microelectronics or diamond-based future electronics.
ICP-MS is a powerful, widely recognized technique for boron isotope analysis. High resolution multi-collector ICP-MS (MC-ICP-MS) is frequently the technique of choice for the most demanding paleoproxy applications, offering accuracy and precision values for boron as low as 0.2 – 0.4‰.6
Quadrupole ICP-MS (Q-ICP-MS) is employed in a number of applications with less rigorous precision and accuracy requirements. This is sometimes used in combination with laser ablation.
Q-ICP-MS can also eliminate a large amount of the noise found in conventional measurements through the use of collisional damping, yielding precisions close to the theoretical possible precision.7
It should be noted that this requires the use of both appropriate instrument hardware and analysis conditions, however.
Despite principally operating as a sequential instrument, Q-ICP-MS offers levels of performance approaching that of MC-ICP-MS. It is possible to obtain sufficient precision for the most demanding applications, offering appropriate analysis at a far lower cost than a multi-collector instrument.
Because Q-ICP-MS is highly versatile and not solely dedicated to isotope ratio measurements, its isotope ratio capabilities have the potential to make high quality isotopic ratio analysis achievable for laboratories with a range of analysis requirements.
Q-ICP-MS has been successfully employed in boron isotope ratio analysis,8 but collisional damping is not often utilized in the published literature. Because of this, published results may not actually show the full potential of Q-ICP-MS.
This series of experiments was designed to evaluate the attainable performance of Q-ICP-MS, fully utilizing the capabilities of PerkinElmer’s NexION® ICP-MS.
Boron isotope ratios were analyzed using a sample depleted in 10B isotope and a regular sample with natural ratio composition. This approach was selected in order to cover two common application scenarios: samples close to the natural ratio and samples with wide ratios.
This article includes instrument setup, calibration, precision, drift and accuracy of isotope ratio measurements. Performance is discussed within the context of the theoretically attainable precision.
While the article is focused on the practical aspects of boron analysis, the experimental setup is described with sufficient background information and practical detail to also provide a robust foundation for users looking to maximize performance in other isotope ratio applications.
Experimental
Samples
Two different sample types were analyzed:
- A general boron single-element concentration standard (non-certified isotopically) 1000 ppm (mg/L) in water (PerkinElmer Inc., USA) that has been diluted to 100 ppb (µg/L) in deionized water
- Boric acid highly depleted in 10B that has been dissolved in deionized water at a concentration of approximately 500 ppb B
Calibration and Reporting of Results
A certified isotopic boron standard VHG-LIS11B-50 (LGC, Teddington, UK) was diluted to 100 ppb B. This was used to determine mass bias during the calibration routine. The 10B/11B ratio in the general boron standard was measured alongside the isotopic boron standard.
The 10B depleted sample was measured alongside the general boron standard, the isotope abundance of which was determined to match that of the certified isotope standard.
Calibration was established using abundance % (for example, atom %) data of the isotopic composition of the reference standard, while isotope ratios are reported as abundance ratio (for example, atomic ratio).
Each analysis was performed using the dedicated isotope ratio analysis method provided within the Syngistix™ for ICP-MS software. The study in question reports the ratio as 10B/11B, with the more abundant 11B included as the denominator.
Precision and accuracy values are provided in percent, with references to the corresponding permil provided values in brackets where appropriate.
Instrument Setup
This study employed a NexION 2000 ICP-MS. The instrument features an analytical quadrupole, as well as a quadrupole Universal Cell to facilitate the controlled removal of interferences. It also includes multiple gas channels to ensure maximum choice of cell gases.
Reaction mode is the best option for precision isotope ratio analysis.7 A cell gas (inert or reactive) is used to thermalize the ions from the plasma, determining their ratios via a process referred to as collisional damping.
The primary advantage of employing Reaction mode in isotope ratio applications is its ability to reduce fluctuations of the ion beam density, therefore reducing measurement noise and expanding the optimal dwell time range from 0.1 ms to several ms.7
The type of gas (for example, helium, argon, or ammonia) and its flow are selected to ensure that enough collisions occur to minimize the energy spread of the analyte ions. By doing so, measurement precision can be improved while maintaining adequate sensitivity.
It is also possible to use reactive cell gases to perform measurements with removal of any on-mass interferences; for example, boron’s isotopes have very low mass and do not suffer from spectral interferences.
When utilizing helium as a suitable choice of collision gas, boron sensitivity remains somewhat unaffected at flows up to 2 mL/min but declines at higher flows (Figure 1). Because only a single gas channel is required for this application, this analysis could be equivalently implemented using a NexION 1000 instrument.
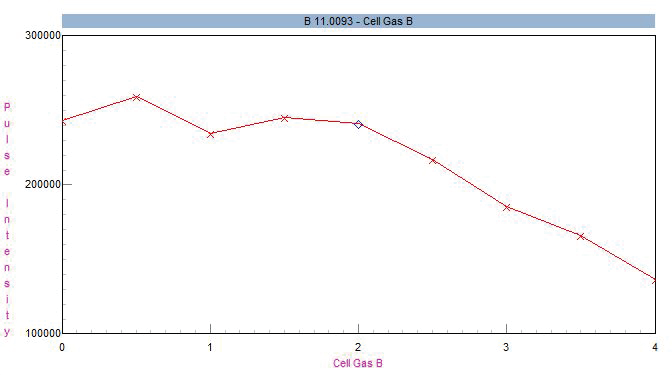
Figure 1. Impact of helium cell gas flow on 11B sensitivity. Image Credit: PerkinElmer
The NexION ICP-MS was configured with a PFA spray chamber, including a self-aspirating PFA nebulizer. It was operated in Reaction mode using 2 mL/min helium, with the nebulizer flow optimized via the daily tuning solution (default criteria) for Ce double charged (<3%) and Ce oxide ratio (<2.5%).
Cell voltages were adjusted for the highest boron sensitivity with a quadrupole settling time of 200 µs. The whole setup is outlined in Table 1.
Table 1. NexION ICP-MS Instrument Setup. Source: PerkinElmer
| Parameter |
Value |
| Nebulizer |
PFA-ST |
| Sample Uptake |
100 µL/min, Self Aspirating |
| Spray Chamber |
PFA Scott at Room Temperature |
| Injector |
2 mm Sapphire |
| Cones |
Pt |
| Plasma Power |
1600 W |
| Plasma Gas |
15 L/min |
| Aux Gas |
1.2 L/min |
| Neb Gas |
1.0 L/min |
| QID |
Fixed at -15.5 V |
| Cell Mode |
Reaction |
| Cell Gas |
Helium, 2 mL/min |
| RPq |
0.45 |
NexION instruments are able to obtain stable measurements at very low settling times. This is a critical component in ensuring that superior isotope ratio precision is achieved because it permits the use of extremely short dwell times while maintaining a high duty cycle.
Here, a duty cycle is defined as the fraction of total active counting time.
The isotope ratio method type was chosen for data acquisition. Settings for this method are reported in Table 2. Dwell times for 10B and 11B were set to accommodate differences between abundances of the boron isotopes.
Table 2. Method Parameters. Source: PerkinElmer
| Parameter |
General Boron Standard
(Natural Abundance) |
Boric Acid with
Depleted 10B |
| Method Type |
Isotope Ratio |
Isotope Ratio |
| Sweeps per Reading |
200 |
300 |
| Readings per Replicate |
10 |
10 |
| Replicates |
10 |
10 |
| Dwell Time 10B |
5 ms |
10 ms |
| Dwell Time 11B |
1 ms |
1 ms |
| Duty Cycle |
94% |
96% |
| Total Analytical Time |
128 s |
6 min 4 s |
The number of ions counted for each isotope should be optimized to ensure the best possible results. This will lead to improved counting statistics during reasonable measurement times.
It is also for this reason that the dwell time for 10B is longer than for 11B, and why the dwell times for 10B are different between the standard and depleted samples. Duty cycle in this example is high (≥94%), demonstrating that the instrument spends at most 6% of its analytical time settling electronics between mass jumps.
Overall, the instrument can be seen to be working efficiently, even when employing dwell times as low as 1 ms.
Effect of Dead Time on Accuracy
It is important to characterize the dead time of the detector system in order to ensure accuracy. Utilizing the proper detector dead time setting becomes essential for isotope ratio accuracy when working at high signal intensities (>105 cps).
With increasing signal, there is an increased likelihood that an ion will reach the detector while the system is processing the preceding ion, resulting in the second ion not being countered.
When this occurs, observed signal measured by the detector could be several % lower than the actual signal of ions reaching the detector. Figure 2 displays the deviation of the true count rate from the observed count rate for three detector speed scenarios.
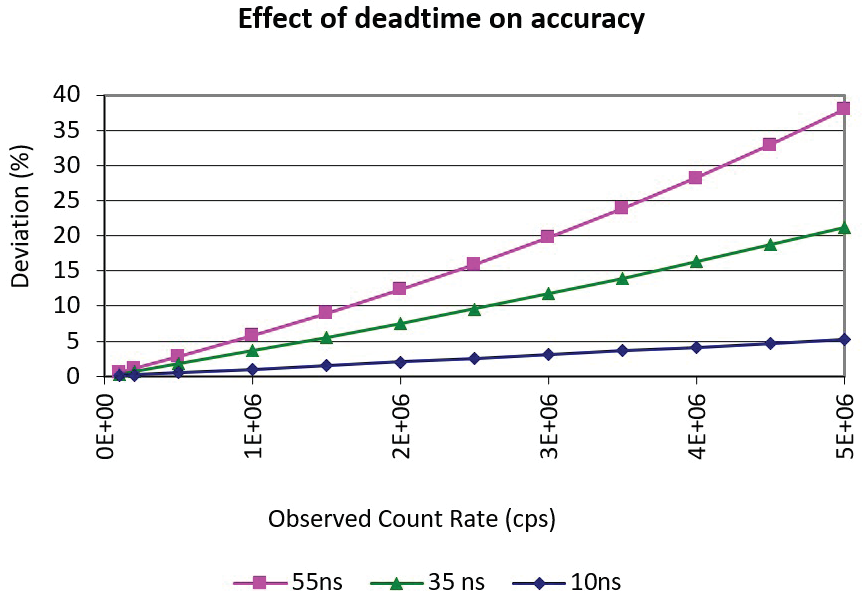
Figure 2. Calculated percent deviation of true count rate from observed count rate for three dead time scenarios. Image Credit: PerkinElmer
The impact of dead time can be and should be accounted for. The software includes a predefined acquisition workspace specifically developed for this purpose – detailed instructions on using this feature are available in the Help menu.
With dead time set correctly, raw signal will be automatically and accurately corrected by the software, allowing measurement of standards and samples to be performed at various signal intensity levels with no risk of introducing bias.
Dual Detector Calibration
Certain circumstances or applications may benefit from the use of dual detector calibration, also referred to as detection ranges cross calibration. This should be considered where measurements cross over between the pulse and analog stages of the detector, for example, when determining ratios <10-4.
In this example, attainable precisions would be severely hindered by the low abundance of the minor isotope should detection be restricted solely to the pulse stage.
This study utilized dual detector calibration for the 10B depleted sample because its wide ratio returned measured intensities that exceeded the pulse stage.
To avoid potential inaccuracies due to dual detector calibration, a commonly used method involves limiting measurements to the pulse stage of the detector as much as possible. This technique was used here for the general (natural) boron standard.
Pulse detector shutdown takes place at 2 Mcps when a detector is optimized with correct detector voltages and a safe operating level is in place below that value to ensure that readings are all collected on the pulse stage.
Users can verify that this is the case by checking there is no ‘detector shutdown’ symbol in the Realtime window when the software is set to ‘pulse detector only’ view.
Boron Washout
Boron is well-known for being a ‘sticky’ element in the sense that it is highly challenging to wash boron out from the sample introduction system and spray chamber.
Direct injection nebulization completely avoids the use of a spray chamber, helping avoid this issue.9 Where available, this should be considered as an alternative sample introduction type.
Boron does not rinse out well with water, so this study used the following four solutions to improve washout: 1% methanol (v/v), 1% mannitol (w/v), 0.5% HF (v/v) and 10% NH4OH (v/v). Figure 3 displays an example of 10% NH4OH improves boron washout in comparison with water.
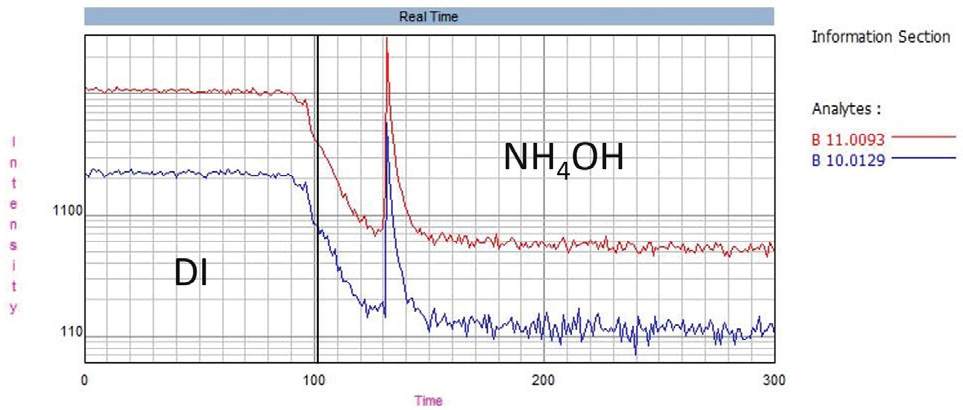
Figure 3. Boron washout, showing the effect of 10% NH4OH (v/v) compared to DI water. Image Credit: PerkinElmer
Washout to a low, reproducible level is vitally important if accurate, stable isotope ratio analyses are to be ensured. This is particularly the case for the depleted 10B sample, where a change in blank level of just 10 cps has the potential to introduce a bias of 1% in the measured isotope ratio.
To help mitigate this, the 10B blank level was monitored closely and maintained at below 50 cps before calibration and before sample measurement.
Results and Discussion
Analysis of a Sample with Natural Abundance Ratio
After calibration has been completed using the certified isotopic standard and any mass bias corrected, a 100 ppb solution of the general B standard was analyzed five times. This was in alternation with the certified isotopic standard in order to establish precision and accuracy.
Table 3. Accuracy and Precision for Five Repeat Measurements of 100 ppb B Solutions. Certified Isotopic Standard. Source: PerkinElmer
| |
Certified Isotopic Standard |
General B Standard |
| Sample |
10B/11B Ratio |
RSD |
10B/11B Ratio |
RSD |
| 1 |
0.2481 |
0.19% |
0.2479 |
0.22% |
| 2 |
0.2477 |
0.31% |
0.2475 |
0.32% |
| 3 |
0.2474 |
0.21% |
0.2473 |
0.27% |
| 4 |
0.2473 |
0.34% |
0.2476 |
0.38% |
| 5 |
0.2474 |
0.23% |
0.2473 |
0.35% |
Group Avg and
Group RSD |
0.2476 |
0.14% |
0.2475 |
0.09% |
Results from this analysis are shown in Table 3 and Figure 4. The means are close, while the overlap of standard deviations is large. The certified isotopic standard possessed a certified 10B/11B ratio of 0.2473 ± 0.0003 (2σ).
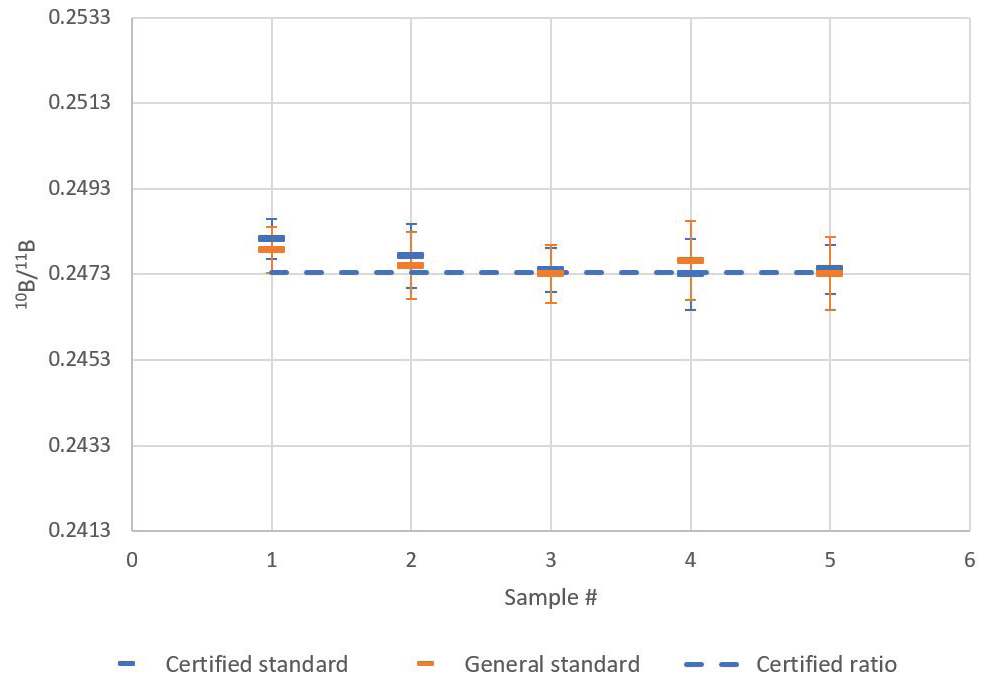
Figure 4. Comparison of certified isotopic standard and general boron standard 10B/11B ratio mean and standard deviation (1 σ error bars) for five repeat sample analyses. Image Credit: PerkinElmer
When this was read back against itself, the measurement produced a group average ratio of 0.2476 ± 0.0003 (1 σ) for five measurements. Accuracy of the average readback was 100.10% (i.e., 1.0‰ deviation), which was comfortably within the ideal range of 1 σ measurement precision (0.14% or 1.4‰).
Here, the 10B/11B ratio for the general boron standard was found to be 0.2475 ± 0.0002 (1 σ).
The difference in the isotope ratio measured between the general boron standard and the certified isotopic standard is minimal (0.03% or 0.3‰) and not considered to be statistically significant.
With this in mind, the isotopic abundance of 10B and 11B in the two solutions can be understood as being identical. When combined, these results confirm that the boron isotope ratios were measured with both high precision and high accuracy.
The attained precision can be compared to the theoretically possible precision as projected by Poisson counting statistics calculations.7
The theoretically attainable precision (for example, RSD) for an individual isotope is equal to the inverse of the square root of collected counts, with the corresponding RSD for the ratio of two isotopes being defined by basic error propagation.
The respective calculation for the experiment outlined here shows that the theoretically attainable precision is 0.19%, with each isotope contributing equally to attainable precision. This shows a good comparison with achieved values ranging from 0.19-0.38% (Table 3).
The collision damping approach used in this example generally allows measurements to remain within 30% of the counting statistics limit.7 Group RSDs (0.15% for certified standard and 0.09% for general standard) are well below the 0.19% theoretical RSD for individual samples. This is in line with statistical expectations.
An additional experiment was performed with the general standard in order to evaluate the best attainable precision over a wider range of acquisition times. Here, the number of sweeps were varied per reading, ranging from 5 to 1000.
The dwell times previously displayed in Table 2 were used to facilitate acquisition of an approximately equal number of counts for each isotope during the course of the acquisition period.
Once again, five sample determinations were undertaken for each sweep setting. Table 4 lists the corresponding analytical time and theoretical RSD expected from counting statistics, alongside the measured sample RSD and group RSDs.
Table 4. Dependence of Measured Precision on Counting Time. Source: PerkinElmer
Sweeps/
Reading |
Sample
Analysis Time |
Counting
Statistics RSD |
Measured
Sample RSD |
Group RSD
(n = 5) |
| 5 |
3 s |
0.74% |
1.22% |
0.44% (4.4‰) |
| 25 |
16 s |
0.33% |
0.53% |
0.11% (1.1‰) |
| 100 |
64 s |
0.17% |
0.29% |
0.083% (0.83‰) |
| 500 |
5 min 20 s |
0.073% |
0.13% |
0.081% (0.81‰) |
| 1000 |
10 min 40 s |
0.052% |
0.066% |
0.037% (0.37‰) |
Sample RSD refers to the distribution of individual replicates about the sample mean in line with the previous experiment. The average RSD for five repeat sample analyses is reported, while group RSD refers to the distribution of a sample analysis result around the group average of all samples.
Figure 5 displays the same data as a graphical display of the relationship of precision. Counting time is shown via the number of sweeps.
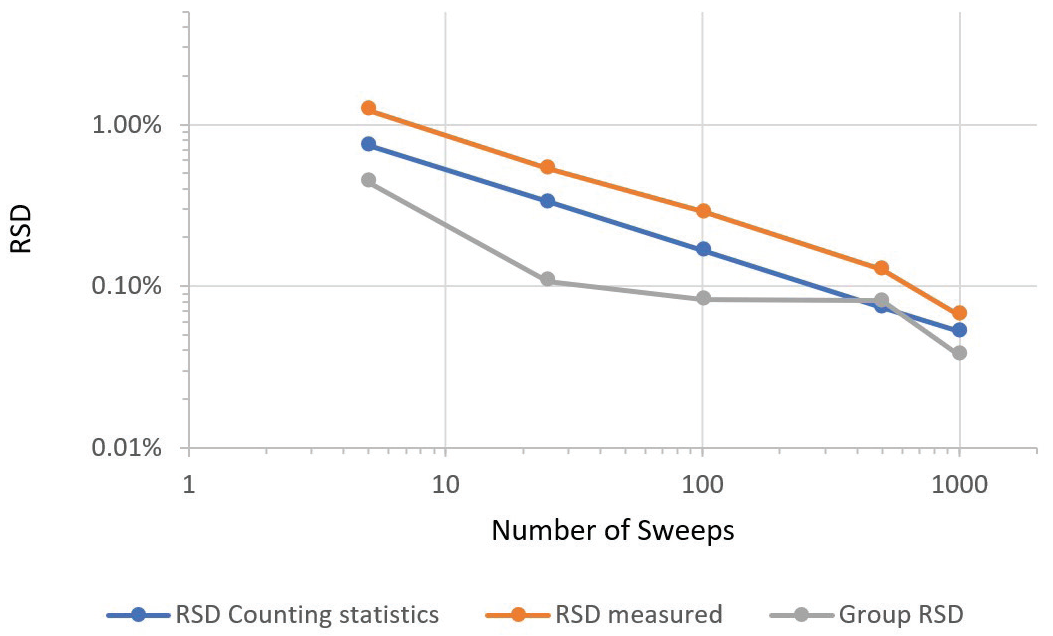
Figure 5. Dependence of precision on counting time, as indicated by number of sweeps. Image Credit: PerkinElmer
Measured sample RSD tracks counting statistics RSD closely. This occurs down to a measured RSD of 0.066% RSD versus a theoretically possible RSD of 0.052% for the longest acquisition time found in the series.
Corresponding group RSDs reveal a similar trend, with the best value of 0.037% (or 0.37‰) attained for the longest counting time. The tight group RSD of 0.037% for the longest measurement series suggests there was no notable drift over the hour that the instrument took to acquire five determinations of the group.
One core benefit of the Triple Cone Interface/Quadrupole Ion Deflector design used in the NexION instrument series is the minimization of drift. This is evidenced by the excellent four-hour drift specification for NexION.
Because Q-ICP-MS does not measure at flat top mass peaks when compared with MC-ICP-MS, improved mass spectrometer stability is necessary to ensure accurate and precise measurements.
Analysis of Boric Acid with Highly Depleted 10B
The instrument was calibrated with the general boron standard – the isotopic composition of which matched that of the certified isotopic standard - before the isotope ratio of the boric acid sample was measured.
Acquisition parameters for this measurement are provided in Table 2. Measurements utilized increased 10B dwell time as well as an increased number of sweeps/reading due to the depleted 10B level of the sample.
The sample was aspirated for a total of 15 minutes to ensure maximum stabilization before being measured ten times successively. Results of these measurements are reported in Table 5.
Table 5. 10 Repeat Measurements of a Sample Highly Depleted in 10B. Source: PerkinElmer
| Sample # |
10B/11B Ratio |
RSD |
| 1 |
0.0008102 |
0.75% |
| 2 |
0.0008090 |
0.58% |
| 3 |
0.0008100 |
0.73% |
| 4 |
0.0008113 |
0.42% |
| 5 |
0.0008085 |
0.67% |
| 6 |
0.0008119 |
0.35% |
| 7 |
0.0008144 |
0.31% |
| 8 |
0.0008117 |
0.44% |
| 9 |
0.0008128 |
0.49% |
| 10 |
0.0008095 |
0.60% |
| Group |
0.0008109 |
0.23% |
The group average 10B/11B ratio was found to be 0.0008109 ± 0.0000019 (1 σ) with a group RSD of 0.23% (2.3‰). Individual sample RSDs acquired (Table 6) compare well against the theoretically attainable precision of 0.53% (Table 6).
The close agreement between these values confirms that the NexION ICP-MS is able to perform measurements at the highest precision theoretically attainable. 10B isotope abundance was the limiting factor for the attainable precision, and this was due to the low intensity of the 10B isotope (Table 6).
Table 6. Counting Statistics for Acquisition of a Sample Highly Depleted in 10B. Source: PerkinElmer
| Isotope |
Integration
Time (s) |
cps |
cts |
RSD |
| 10B |
30 |
1195 |
35844 |
0.53% |
| 11B |
3 |
1809435 |
5428306 |
0.04% |
| 10B/11B |
|
|
|
0.53% |
The graphical display of the data in Figure 6 shows clearly that there was no drift in this instance.
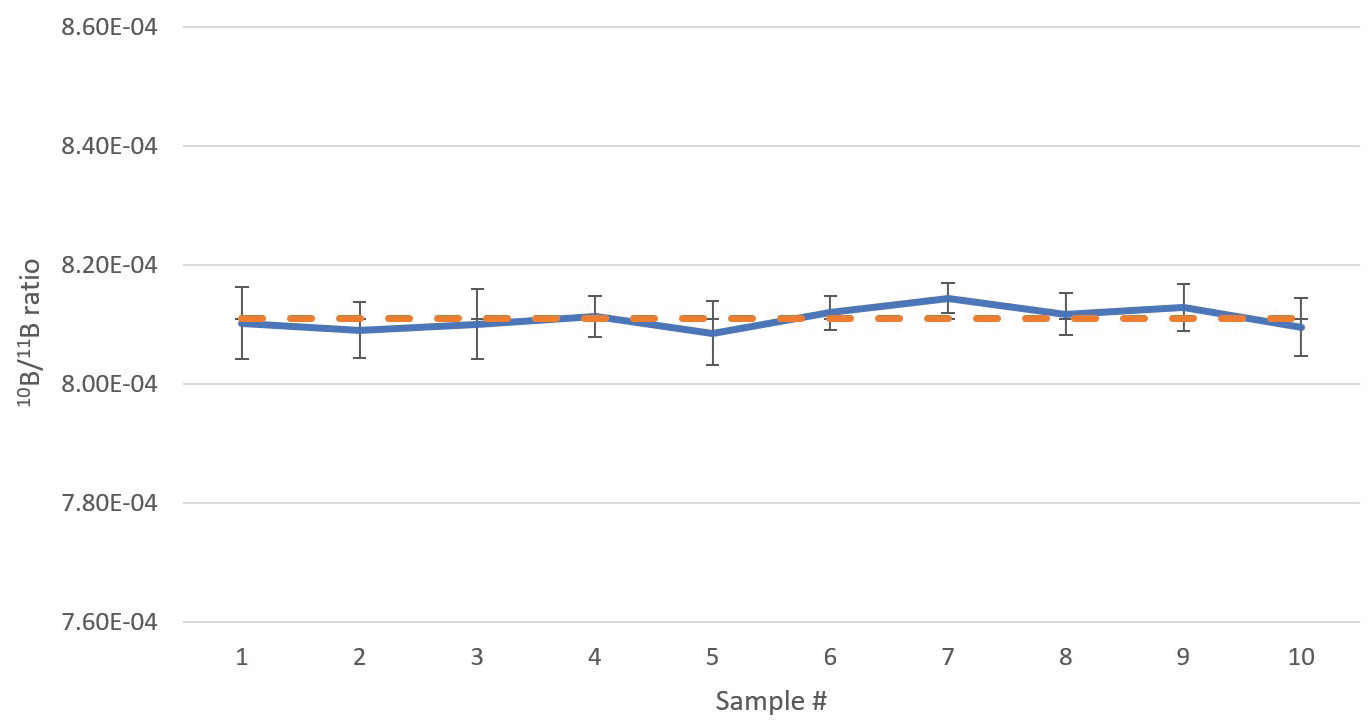
Figure 6. Boron isotope ratios of a boric acid sample depleted in 10B, analyzed 10 times in direct succession. Error bars indicate standard deviation of the measurements. The dashed orange line indicates the average ratio of the 10 analyses. Analysis time 6 min 4 sec per sample. Image Credit: PerkinElmer
Conclusion
In summary, a boric acid sample highly depleted in 10B was analyzed with the NexION ICP-MS. Collisional damping was used, and a total of ten repeat analyses yielded a 10B/11B group average of 0.0008109 ± 0.0000037 (2σ).
Measured precision was found to be at the level predicted by counting statistics, verifying that the NexION ICP-MS is capable of measuring at the best possible level of precision. Additionally, this result shows exceptional blank control on account of the low levels of 10B involved.
The instrument was capable of reading back a solution of known natural abundance with high accuracy, averaging 0.10% (1.0‰) deviation. This was comfortably within the measurement precision of that experiment (0.14% or 1.4‰), and no drift was apparent during any batch measurement.
Where attainable precision was not limited by the low abundance of a particular isotope, excellent precisions were achieved at moderate counting times (ca. 10 minutes), as low as 0.066% (0.66‰) for individual measurements, 0.037% (0.37‰) for measurement groups and within 30% of the limit of counting statistics.
This is close to (factor of 2-3) the performance of multi-collector ICP-MS, despite being less than 30% of the price.
Overall, the NexION ICP-MS’s sophisticated instrumental features delivered superb performance for boron isotope ratio measurements when operated in Reaction mode at high scan speeds with a superb duty cycle.
References
- Holden, N. E., Martin, R. L., and Barnes, I. L. (1991). Isotopic compositions of the elements 1989. Pure and Applied Chemistry, 63(7), 991–1002.
- Meija, J. et al. (2016). Isotopic compositions of the elements 2013 (IUPAC Technical Report). Pure and Applied Chemistry, 88(3), 293–306.
- IUPAC(a), Commission on Isotopic Abundances and Atomic Weights. www.ciaaw.org/natural-variations.htm, accessed Feb. 2020.
- Marschall, H. R., and Foster, G. L. (2018). Boron Isotopes in the Earth and Planetary Sciences—A Short History and Introduction. In Advances in Isotope Geochemistry: Boron Isotopes (pp. 331–334). Springer International Publishing AG
- IUPAC(b), Periodic Table of the Isotopes. www.isotopesmatter.com, accessed Feb. 2020.
- Aggarwal, S. K., and You, C. F. (2017). A review on the determination of isotope ratios of boron with mass spectrometry. Mass Spectrometry Reviews, Vol. 36, pp. 499–519.
- Bandura, D. R., and Tanner, S. D. (2000). Effect of collisional damping in the dynamic reaction cell on the precision of isotope ratio measurements. Journal of Analytical Atomic Spectrometry, 15, 921–928.
- He, M., Jin, Z., Luo, C., Deng, L., Xiao, J., and Zhang, F. (2015). Determination of boron isotope ratios in tooth enamel by inductively coupled plasma mass spectrometry (ICP-MS) after matrix separation by ion exchange chromatography. Journal of the Brazilian Chemical Society, 26(5), 949–954.
- Aggarwal, J. K., Sheppard, D., Mezger, K., and Pernicka, E. (2003). Precise and accurate determination of boron isotope ratios by multiple collector ICP-MS: Origin of boron in the Ngawha geothermal system, New Zealand. Chemical Geology, 199(3–4), 331–342.
Consumables Used
Table 7. Source: PerkinElmer
| Component |
Part Number |
| PFA-ST Nebulizer |
N8145368 |
| PFA Scott Spray Chamber |
N8152390 |
| 2 mm Sapphire Injector |
N8152447 |
| Platinum Sampler Cone |
W1033614 |
| Platinum Skimmer Cone |
W1026907 |
| Boron Standard, 1000 ppm |
N9303760 (125 mL)
N9300106 (500 mL) |
| Autosampler Tubes |
B0193233 (15 mL)
B0193234 (50 mL) |

This information has been sourced, reviewed and adapted from materials provided by PerkinElmer.
For more information on this source, please visit PerkinElmer.