ICP-OES is frequently employed in the determination of trace elements in metallurgical matrices due to its ability to accommodate high levels of dissolved solids with no need to utilize matrix separation schemes or special sample introduction components.
Because sample preparation does not require large dilution factors, analyte levels introduced to the instrument will not be significantly impacted by dilutions.
Despite these notable benefits, spectral interferences may pose a particular challenge when using ICP-OES for the analysis of trace metals in metallurgical matrices. A large number of elements display many emission lines; for example, iron has approximately 20,000.
High numbers of emission lines increase the potential for spectral interferences, and this effect is intensified in metallurgical samples as matrix element(s) tend to be present at high levels as a result of the minimal dilutions utilized.
A number of methodologies are able to deal with spectral interferences, but PerkinElmer’s exclusive Multicomponent Spectral Fitting (MSF) algorithm1 is one of the most robust and user-friendly available.
The software constructs a multiple least squares model from known blank, analyte and interference spectra, enabling the deconvolution of spectra and the production of interference-free peaks.
MSF’s robustness is centered around its lack of reliance on background point setting or on a limited number of data points. Rather, MSF incorporates all available spectral information.
This article outlines the analysis of a challenging metallurgical sample using PerkinElmer’s Avio® 550 Max fully simultaneous ICP optical emission spectrometer (ICP-OES), employing MSF to obtain exact results.
Experimental
Samples and Sample Preparation
The sample being analyzed was made up of 7500 mg/L Fe, 1500 mg/L Cr and 1000 mg/L Ni in 16% aqua regia (v/v). It was analyzed without dilution. 1% (10000 mg/L) total dissolved solids content was entered into the instrument.
External matrix-matched calibration curves were used to make measurements. These were composed of 0.02, 0.05 and 0.1 mg/L standards prepared in 16% aqua regia, while yttrium (Y) was utilized as an internal standard.
A blank was also used in the form of an MSF model created using 2% HNO3 (v/v) and 0.1 mg/L analytes in 2% HNO3. This was designed to replicate the matrix as the interference; for example, creating a solution of 7500 mg/L Fe + 1500 mg/L Cr + 1000 mg/L Ni in 16% aqua regia from single-element standards.
Instrumental Conditions
Analyses were conducted using an Avio 550 Max ICP-OES in combination with the Syngistix™ for ICP software. This software package has the unique ability to run one or more analytes in normal, high, or low resolution modes.
Table 1 outlines specific instrumental parameters, while Table 2 lists the analytes and wavelengths used. Samples were introduced using the standard system, which incorporated a SeaSpray™ nebulizer for improved sensitivity and to ensure compatibility with high matrix samples. Each analysis was performed in axial mode.
Table 1. Avio 550 Max ICP-OES Instrumental Parameters and Conditions. Source: PerkinElmer Inc.
| Parameter |
Value |
| Nebulizer |
SeaSpray™ |
| Spray Chamber |
Baffled glass cyclonic |
| RF Power |
1500 W |
| Injector |
2.0 mm alumina |
| Plasma Gas Flow |
14 L/min |
| Aux. Gas Flow |
0.4 L/min |
| Nebulizer Gas Flow |
0.62 L/min |
| Torch Position |
-4 |
| Plasma View |
Axial |
| Resolution |
Normal |
| Sample Uptake Rate |
1.50 mL/min |
| Sample Uptake Tubing |
Black/Black (0.76 mm id), Viton |
| Drain Tubing |
Red/Red (1.14 mm id), SolvaFlex |
| Replicates |
3 |
| Read Time |
5 sec (min and max) |
Table 2. Elements and Wavelengths. Source: PerkinElmer Inc.
| Element |
Wavelength (nm) |
| B |
208.957 |
| Ce |
456.236 |
| La |
408.672 |
| Nb |
313.079 |
| Nd |
430.358 |
| Sn |
189.927 |
| Zr |
343.823 |
Results and Discussion
Analyses initially took place in high resolution mode in order to resolve spectral interferences.
While it was possible to achieve adequate spectral resolution, the associated reduction in sensitivity meant that it was not possible to achieve accurate measurements at the low concentration levels for analytes in the sample. Because of this, normal resolution was utilized alongside MSF to resolve spectral interferences where they were found.
Figure 1 displays spectra for lanthanum (La) at 408.672 nm, providing an example of a wavelength that has been sufficiently resolved without using MSF. The La peak is found between two matrix peaks: Ni and Fe. The sample (green plot) shows a small peak for La, corresponding to approximately 9 µg/L.
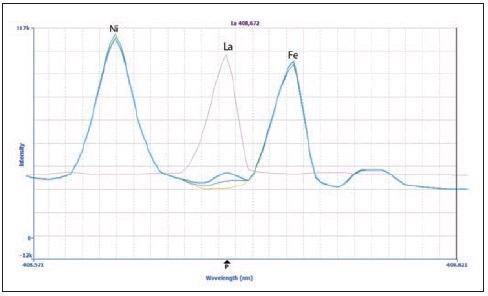
Figure 1. Spectra of La 408.672 nm in the sample (green), 20 μg/L La spike in the sample (blue), 100 μg/L La in 2% HNO3 (pink) and a matrix blank (yellow). Image Credit: PerkinElmer Inc.
La was analyzed in 2% HNO3 (pink) in order to confirm the La peak’s identity, as well as in the calibration standards (the 20 µg/L spectrum is displayed in blue). The peak was confirmed to be La because all the peaks were shown to align.
MSF’s capacity to resolve interferences is clear when examining zirconium (Zr) at 343.823 nm (Figures 2 and 3). Figure 2 shows the spectra of the matrix blank (yellow), matrix blank plus 20 µg/L spike (blue), sample (green) and 100 µg/L Zr in 2% HNO3 (pink).
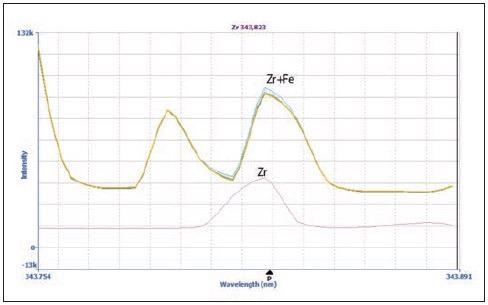
Figure 2. Spectra of Zr 343.823 nm in the sample (green), 20 μg/L Zr spike in the sample (blue), matrix blank (yellow) and 100 μg/L Zr in 2% HNO3 (pink). Image Credit: PerkinElmer Inc.
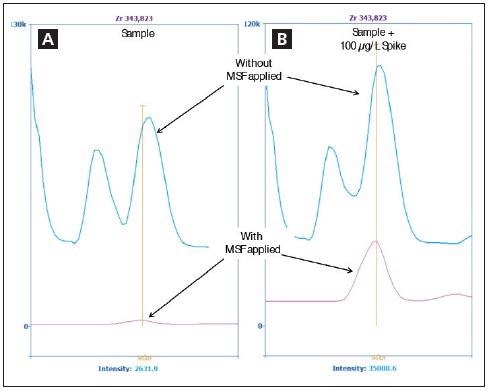
Figure 3. Spectra of Zr 343.823 nm in the sample (A) and in the sample spiked with 100 μg/L Zr (B) without MSF applied (blue) and with MSF applied (pink). Image Credit: PerkinElmer Inc.
Minimal differences were observed in the spectra of the matrix blank, 20 µg/L spike, and sample in terms of both peak shape and intensity.
The peak shape of the Zr peak without the matrix (pink) does differ from the peak shape of the other spectra, however. Here, the difference in peak shape signifies the presence of an interference that originates from the matrix.
It should be noted that Fe displays an emission line very near to that of Zr (Fe = 343.831 nm; Zr = 343.823 nm), resulting in distortions of the peak that originate from the matrix.
Figure 2 suggests that it is not possible to accurately measure Zr in the presence of Fe. However, application of MSF removes the interfering peaks, allowing the Zr peak to be seen clearly seen (Figure 3). Figure 3a shows a sample spectrum without MSF applied (blue), alongside results following the application of MSF (pink).
In order to verify that the peak in the pink spectrum in Figure 3a is, in fact, Zr, the sample was spiked with 100 µg/L of Zr before being analyzed once again with MSF applied. Figure 3b displays the larger pink peak, therefore confirming the presence of additional Zr.
Once the MSF model had been established and applied, the sample was analyzed with a 100 µg/L analyte spike. Results (Table 3) revealed that all spike recoveries are within 15% of the true values, confirming the accuracy of the results.
Table 3. Spike Recovery Results. Source: PerkinElmer Inc.
| Element |
Sample
(μg/L) |
Sample + Spike
(μg/L) |
% Recovery |
| B |
4.34 |
101 |
97 |
| Ce |
9.78 |
112 |
102 |
| La |
9.82 |
113 |
103 |
| Nb |
5.07 |
110 |
105 |
| Nd |
6.69 |
111 |
104 |
| Sn |
0.9 |
109 |
108 |
| Zr |
11.3 |
111 |
100 |
Conclusions
The example outlined here demonstrates the capacity of PerkinElmer’s Avio 550 Max of fully simultaneous ICP-OES in successfully resolving challenging interferences in a metallurgical sample using Multicomponent Spectral Fitting (MSF).
MSF facilitates analysis of samples in normal resolution mode, ensuring there is no loss of intensity at the expense of resolution. Metallurgical samples include a limited number of matrix components, but these tend to be present at high levels, leading to frequent spectral interferences.
Most interferences can be resolved through the application of MSF, making this a valuable tool in the analysis of impurities in alloys and metals.
References
- “Multicomponent Spectral Fitting,” Technical Note, PerkinElmer Inc., 2016.
Consumables Used
Table 4. Source: PerkinElmer Inc.
| Component |
Part Number |
| Sample Uptake Tubing, Black/Black (0.76 mm id), PVC |
N0777043 (flared)
09908587 (non-flared) |
| Drain Tubing, Red/Red (1.14 mm id), PVC |
09908585 |
| SeaSpray™ Nebulizer |
N0775345 |
| Boron Standard, 1000 mg/L |
N9300106 (125 mL)
N9303760 (500 mL) |
| Cerium Standard, 1000 mg/L |
N9303765 (125 mL)
N9300110 (500 mL) |
| Chromium Standard, 10000 mg/L |
N9304309 (125 mL)
N9304311 (500 mL) |
| Iron Standard, 10000 mg/L |
N9304113 (125 mL)
N93007117 (500 mL) |
| Lanthanum Standard, 1000 mg/L |
N9303780 (125 mL)
N9300127 (500 mL) |
| Neodymium Standard, 1000 mg/L |
N9303787 (125 mL)
N9300135 (500 mL) |
| Nickel Standard, 10000 mg/L |
N9304117 (125 mL)
N9304116 (500 mL) |
| Niobium Standard, 1000 mg/L |
N9303786 (125 mL)
N9300137 (500 mL) |
| Tin Standard, 1000 mg/L |
N9303801 (125 mL)
N9300161 (500 mL) |
| Zirconium Standard, 1000 mg/L |
N9303812 (125 mL)
N9300169 (500 mL) |
| Autosampler Tubes |
B0193233 (15 mL)
B0193234 (50 mL) |

This information has been sourced, reviewed and adapted from materials provided by PerkinElmer.
For more information on this source, please visit PerkinElmer.