With its sophisticated platform, the Thermo ScientificTM ARLTM PERFORM’X wavelengthdispersive X-ray fluorescence (WDXRF) spectrometer offers a quick and accurate way to analyze up to 90 components in almost any type of liquid or solid sample. Benefits compared to alternative analytical methods are:
- Quick and easy sample preparation
- Examination of a sample’s whole surface, a portion of it, or certain areas
- Speed of analysis
- High stability and exceptional precision
- Wide dynamic range (from ppm levels to 100%)
- Using sophisticated standard-less analysis software, it is possible to quickly and easily analyze completely unknown materials
In addition to setting new benchmarks for speed, dependability, and flexibility on the broadest variety of sample types, the small ARL PERFORM’X spectrometer design offers exceptional XRF analytical benefits, such as sensitivity, repeatability, and ease of use.
It will address quality applications in various sectors, including metallurgy, petroleum, polymers, mining, glass, cement, refractories, and others, as well as composition issues in demanding industrial processes. Its performance and adaptability will also benefit academic or research labs in geochemistry, automobile engineering, materials science, environmental studies, and forensics.
- Speed of analysis
- Fastest goniometer in industry
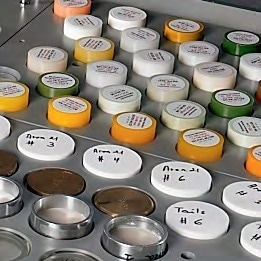
- High sample throughput using a dual sample loading mechanism
- Up to 60 samples per hour, unmanned
- Specialized loading area for expedited samples
- Flexibility
- Choice of power levels: 1500W, 2500W or 4200W
- Mid-power systems without external water chiller
- An automated X-Y sample changer with many positions frees up personnel for other tasks
- Several crystal and collimator options are available in the new goniometer design, providing the broadest analytical range conceivable.
- Choosing the observed diameter in numerous stages, ranging from a big 35 mm region to a small 0.5 mm spot
- There are several beam filters available, so each element could have its ideal analysis settings selected
- Sensitivity and Precision
- An ultra-thin X-Ray tube window increases light element sensitivity
- Unique Thermo Scientific™ UCCO™ technology (Ultra Closely Coupled Optics)
- Excellent peak-to-background ratio
- Superior short-term repeatability and long-term stability
- Highest standards of reliability
- Create with dependability in mind for optimal uptime and simple maintenance
- The fully computerized, frictionless goniometer ensures outstanding lifetime angular accuracy
- Use a security mechanism to collect dust/liquid if a pressed pellet/liquid cell breaks accidentally while loading
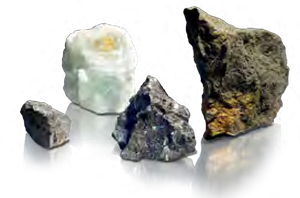
Geological applications among others require fast and accurate goniometer. Image Credit: Thermo Fisher Scientific - Elemental and Phase Analysis
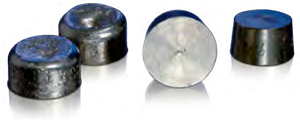
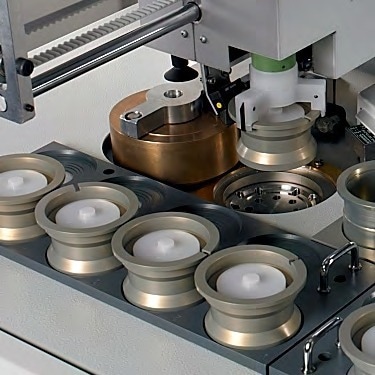
Dual sample loading and urgent sample position when speed is required, more specifically in metallurgy. Image Credit: Thermo Fisher Scientific - Elemental and Phase Analysis
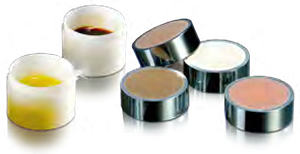
Collection pot for safe loading of pressed powders and liquids. Image Credit: Thermo Fisher Scientific - Elemental and Phase Analysis
Powerful Add-ons for Problem Solving and R&D
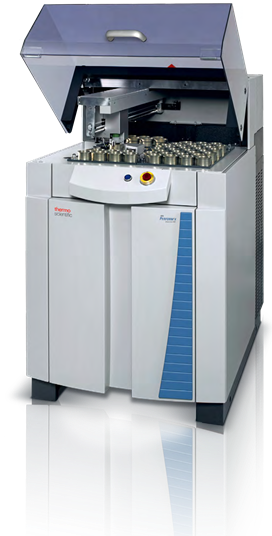
Image Credit: Thermo Fisher Scientific - Elemental and Phase Analysis
The ARL PERFORM’X spectrometer adds value to the laboratory by offering additional capabilities for challenging, non-routine studies.
- Complete characterization of unknown samples without calibration standards
- Thermo Scientific™ QuantAS™ software allows for the semi-quantitative examination of unknown substances in three minutes utilizing scans ranging from fluorine to uranium
- Thermo Scientific™ UniQuant™ software, the industry leader, offers the greatest detection and accuracy limits in standard-less analysis up to Am (Z=95)
- Small spot analysis & mapping
- Focus precisely on specimen sections using a 0.5- or 1.5-mm adjustable X-Ray diameter
- Cartography allows for element distribution maps at 0.1 mm resolution
- Enables analysis of sample homogeneity and inclusions for process improvement and problem resolution
- Safe and stable liquids analysis
- The helium shutter enhances goniometer stability and protection for liquid analysis
- The X-Ray tube window is shielded against liquid spills and loose powders by an optional tube shield
- Simple and secure transfers between solids and liquids are ensured by the sample recognition sensor
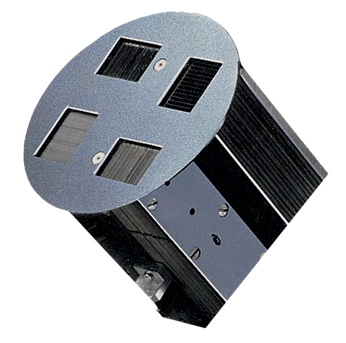
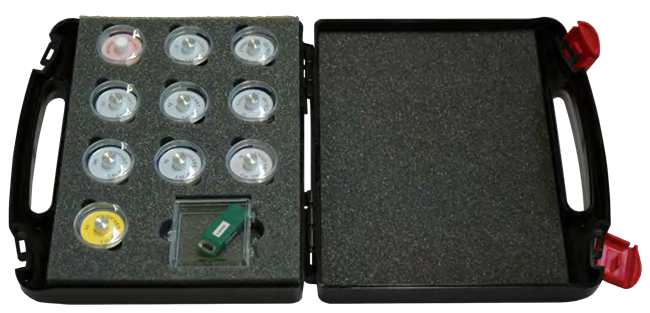
Cassettes of various apertures for small and large samples. Image Credit: Thermo Fisher Scientific - Elemental and Phase Analysis
Helium shutter for easy and stable liquid analysis. Image Credit: Thermo Fisher Scientific - Elemental and Phase Analysis
Elemental mapping of inhomogeneous sample or small spot analysis. Image Credit: Thermo Fisher Scientific - Elemental and Phase Analysis
Large sample collections run automatically overnight. Image Credit: Thermo Fisher Scientific - Elemental and Phase Analysis
State-of-the-Art Components for Highest Flexibility
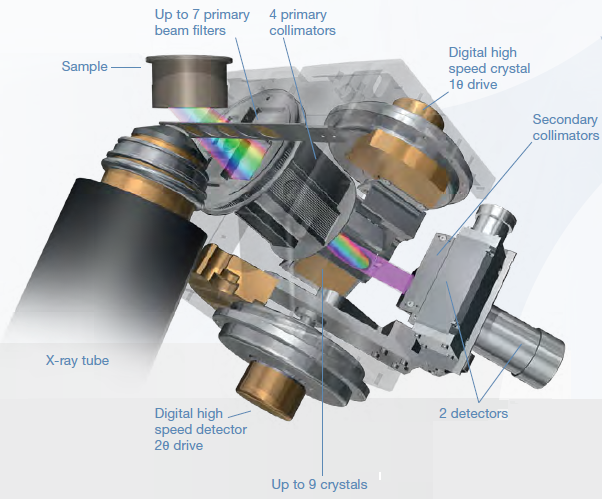
The ARL PERFORM’X spectrometer now features a 6th generation goniometer that is entirely digitally mastered, allowing for faster and more accurate measurements.
The goniometer can be set up to do quantitative or qualitative analysis on certain elements, which involves scanning the X-Ray spectrum to find elements in a given sample. With up to nine analytical crystals and four collimators, this cutting-edge compact goniometer offers analysts a greater variety of applications. The extremely small goniometer technology increases elemental signal count rates by up to 25%. At high count rates, improved detector linearity yields superior counting statistics.
Adding seven primary X-Ray beam filters also broadens the analytical range, minimizing interference from X-Ray tube emission lines on some elements and significantly enhancing peak-to-background ratios for most elements.
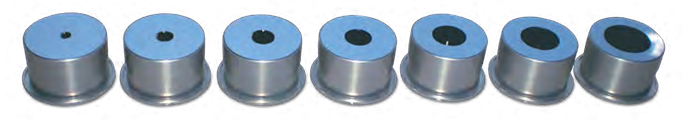
The number of sample types that can be studied is increased by additional optional features, such as the 4-position programmed aperture changer. There is a 29 mm aperture by default, and three other apertures with the following sizes are selectable: 0.5, 1.5, 5, 10, 15, 20, 25, and 35 mm to facilitate the examination of both small and big samples.
The X-Ray tube’s LoVap filament technology, which operates at a lower temperature and eliminates drift caused by tungsten vapor plating on the beryllium tube window, offers long-term stability. A closer coupling between the anode and sample is also made possible by developing the X-Ray tube cone. For every element in the periodic table, this results in increased sensitivity and decreased detection limits.
- Gearless digital goniometer advantages
- Quantitative analysis can be performed on any element from Be to Am, provided enough crystals are fitted
- Moiré fringe optical encoders provide angular positioning
- No friction – No wear
- Ensures a precise θ/2θ connection between crystal and detector
- Excellent angular positioning and high precision
- Fastest positioning with a slewing speed of 4800°/min
- Fast scanning up to 500° per minute
- Controlling crystal temperature for optimal analytical stability
- Effective standard-less analysis using QuantAS and UniQuant software packages
- Unique polarization effect for reduced background
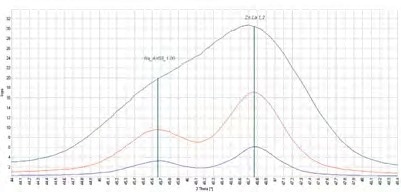
Effect of collimator on resolution and intensity. Image Credit: Thermo Fisher Scientific - Elemental and Phase Analysis
Evolution of the X-Ray Tubes Over the Years
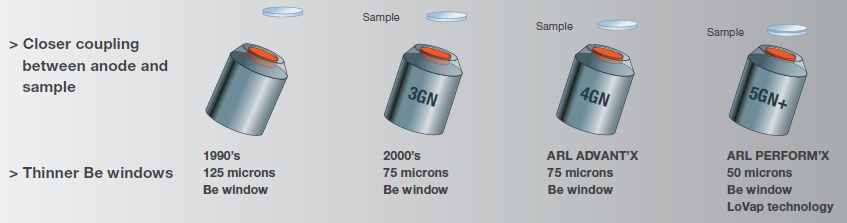
Image Credit: Thermo Fisher Scientific - Elemental and Phase Analysis
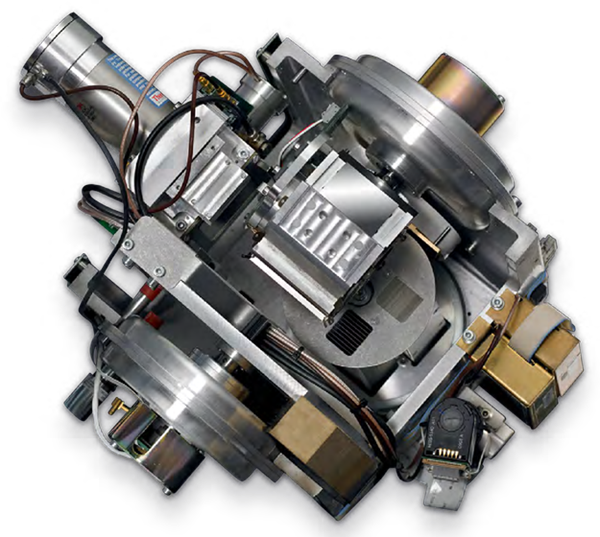
6th generation universal gearless goniometer. Image Credit: Thermo Fisher Scientific - Elemental and Phase Analysis
Removal of Rh tube lines with primary beam filter. Image Credit: Thermo Fisher Scientific - Elemental and Phase Analysis
Four collimator changer as standard. Image Credit: Thermo Fisher Scientific - Elemental and Phase Analysis
UCCO™ technology. Ultra Closely Coupled Optics between X-Ray tube and sample. Image Credit: Thermo Fisher Scientific - Elemental and Phase Analysis
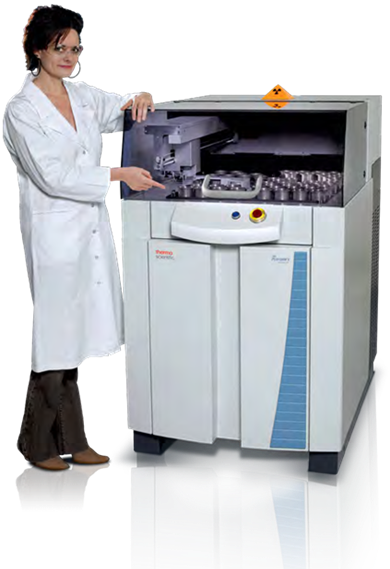
Image Credit: Thermo Fisher Scientific - Elemental and Phase Analysis
Right on the Spot! Choice of Analyzed Area Size
Small Sample Analysis
For regular examination of small samples, a programmable aperture changer is an optional feature. It works in tandem with cassettes that have corresponding apertures between 35 and 5 mm (normal diameter is 29 mm; alternative sizes include 5, 10, 15, 20, 25, and 35 mm).
Small Spot Analysis
- Specimen selection for narrow spot analysis using the on-board camera
- Pinpoint focus with 1.5 mm or 0.5 mm X-Ray beam diameters
- When paired with UniQuant standard-less analysis software, permits complete quantification
- Perfect for failure analysis and samples used in forensics, automotive, industrial, metallurgy, and other R&D applications
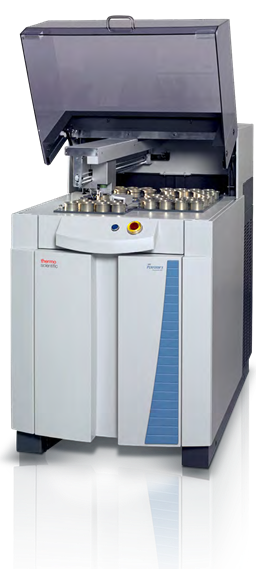
Image Credit: Thermo Fisher Scientific - Elemental and Phase Analysis
Mapping
The ARL PERFORM’X spectrometer’s finely calibrated X-Ray mapping capabilities offer comprehensive elemental imaging of intricate non-homogenous surfaces. Elements that are undetectable by other examination techniques, such as inclusions, gradients, and impurities, can be recognized and described by analysts.
- Cartography control and overlay using 0.5 mm or 1.5 mm spots
- Create intricate composite maps showing the distribution of elements in the samples
- For applications involving process optimization and problem-solving, fine resolution down to 0.1 mm steps
- For complete quantification, it can be used in conjunction with UniQuant standard-less analysis software
- Perfect for applications in materials engineering across a range of sectors
Results of a Mapping of an Inclusion in a Glass Sample
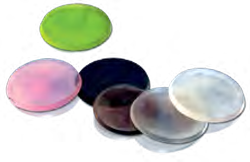
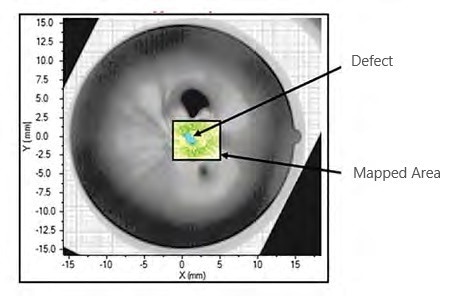
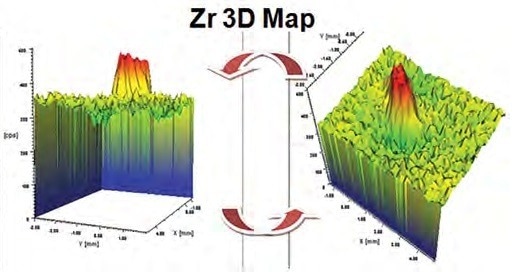
Image Credit: Thermo Fisher Scientific - Elemental and Phase Analysis
Automatic Sample Loading Creates Productivity
The ARL PERFORM’X spectrometer could be located right above the sample changer. It can handle a maximum capacity configuration of 112 samples for unattended and overnight analysis, accommodating various sample sizes. Any urgent sample may be put on the designated “urgent” spot at any moment to be processed first.
Without the requirement for cassettes, a series of homogeneous-sized and shaped samples (such as polymer discs, pressed pellets, fusion beads, etc.) can be put directly into trays.
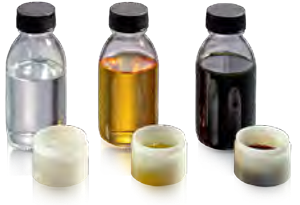
For liquid analysis, specialized cassettes are utilized to ensure that liquids are never loaded under vacuum.
An automated sample preparation equipment can be connected to for continuous online process monitoring in the unattended mode. The ARL PERFORM’X spectrometer and the automated press, mill, or fusion machine will be connected by a simple transport belt. The spectrometer and the preparation equipment can interact, thanks to the OXSAS/OEM software option.
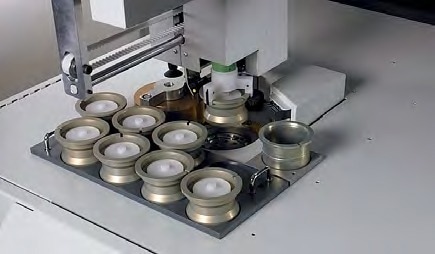
Image Credit: Thermo Fisher Scientific - Elemental and Phase Analysis
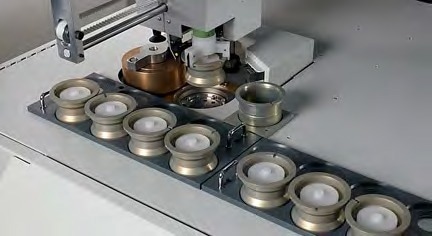
Image Credit: Thermo Fisher Scientific - Elemental and Phase Analysis
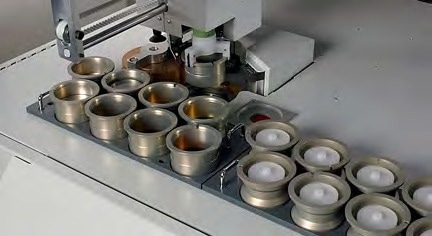
Image Credit: Thermo Fisher Scientific - Elemental and Phase Analysis
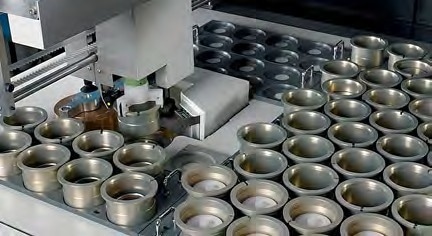
Image Credit: Thermo Fisher Scientific - Elemental and Phase Analysis
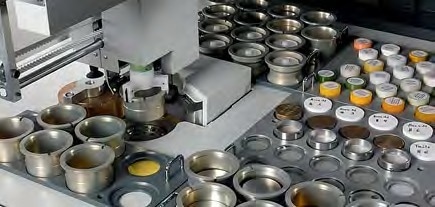
Image Credit: Thermo Fisher Scientific - Elemental and Phase Analysis
Special cassettes for liquid cell loading. Image Credit: Thermo Fisher Scientific - Elemental and Phase Analysis
OXSAS Software
Easy and Comprehensive XRF Analysis
Thermo Scientific™ OXSAS™ software makes using the ARL PERFORM'X spectrometer easy and generates accurate, visually appealing analytical data. OXSAS software uses the Windows® 10 operating system and evolves to suit client demands with up-to-date solutions during the instrument’s lifespan. The OXSAS software product specification document provides comprehensive information on all features and details.
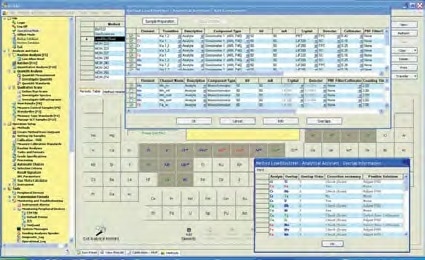
The Analytical Assistant helps define analytical programs, calibrations and instrument use. Image Credit: Thermo Fisher Scientific - Elemental and Phase Analysis
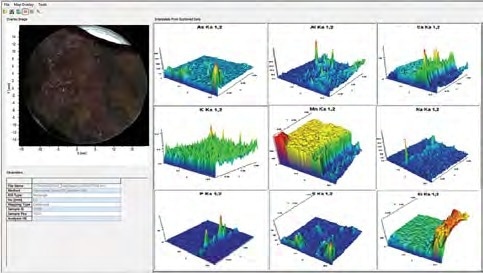
Typical screen of a mapping study. Image Credit: Thermo Fisher Scientific - Elemental and Phase Analysis
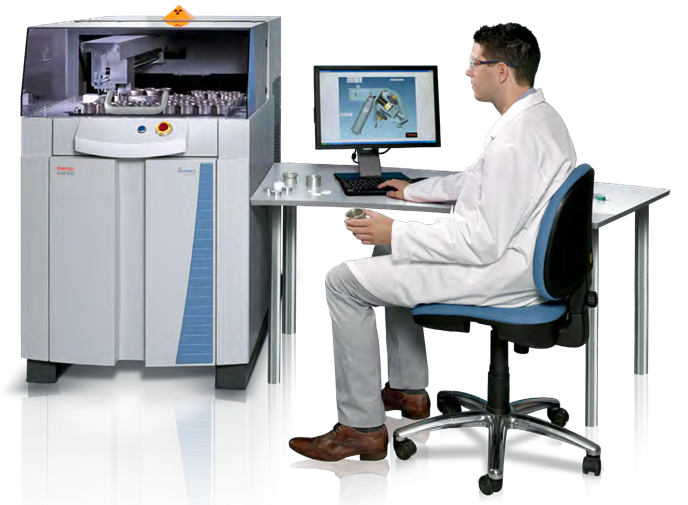
Image Credit: Thermo Fisher Scientific - Elemental and Phase Analysis
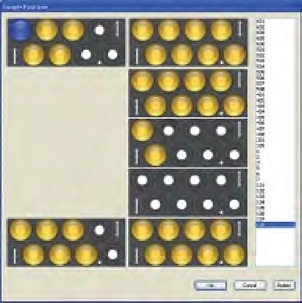
Selection of sample positions from a graphical view of the magazine. Image Credit: Thermo Fisher Scientific - Elemental and Phase Analysis
Fast and Accurate Analysis
Fast Qualitative Analysis
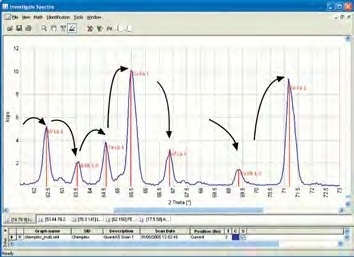
Step scanning can precisely define peaks with a precision of 0.001°. Continuous digital scanning captures spectra up to 500° per minute, making it ideal for rapid qualitative analysis. Peaks are automatically identified as representing the components present.
Accuracy Made Easy
The online Analytical Assistant allows for rapid and accurate definition of analytical programs and calibrations. The multi-variable regression (MVR) software is used to generate calibration curves. Correction models decrease the effect of interfering components in multi-component matrices, improving analytical accuracy. The models are:
- Line overlap correction
- Additive correction on intensities
- Additive correction on concentrations
- Multiplicative correction on intensities
- Multiplicative correction on concentrations
- Multiplicative and additive corrections on concentrations
- Comprehensive Lachance (COLA) with 3 term alphas is utilized with NBSGSC fundamental parameters software, replicating analytical calibrations for homogenous materials. Inter-element correction factors (theoretical alphas with matrix and LOI/GOI reduction) are generated and utilized as known coefficients in MVR. This reduces the need for several calibration standards and enhances analytical accuracy.
Turnkey Calibrations
Ex-works calibrations can be provided for numerous materials, including:
- Oil industry products using Thermo Scientific™
- PetroilQuant™ program or ASTM/ISO methods
- Iron, steel and slags
- Copper, bronze and brass
- Aluminum and alloys
- Various oxides through the General Oxide calibration and the Minerals/Ceramics calibration
- Cement and clinker, limestone and dolomite, glasses, polymers
- Traces in soils and sediments
- Ferro-alloys and others for which analytical specifications are available on request
- Majors, minors and traces in rocks
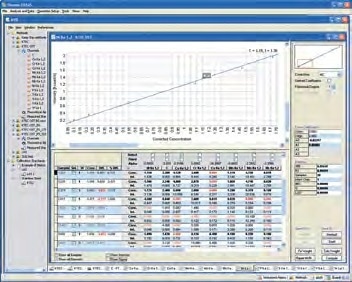
MVR Calibration curve showing real concentrations vs. intensities. Image Credit: Thermo Fisher Scientific - Elemental and Phase Analysis
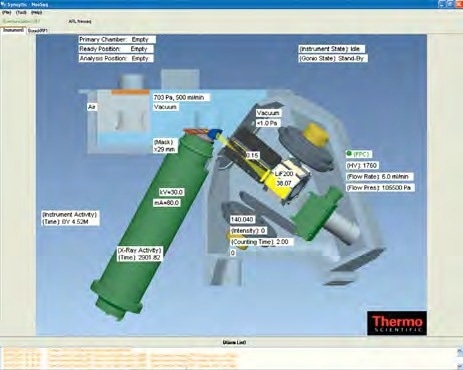
Current operations and status can be checked with the on-line synoptic screen. Image Credit: Thermo Fisher Scientific - Elemental and Phase Analysis
Total Elemental Analysis- A Unique Advantage
XRF has a distinct advantage over other elemental analysis techniques as it can measure elemental concentrations without calibration standards.
QuantAS – Scan-Based Standard-Less Software
Unknown liquid or solid sample concentration levels can be rapidly ascertained with the help of the user-friendly QuantAS software. In about three minutes, the scans that span 70 elements—from fluorine to uranium—can be completed.
The automatic processes of smoothing, background removal, peak identification, overlap and matrix corrections, semi-quantitative concentration computation, and normalization enable quick and simple measurement of unknown materials. Type standardization is offered for the highest level of accuracy. For setup and upkeep over time, four multielement examples are included.
From the manufacturer, the optional QuantAS software is installed and calibrated to perfection. Due to this, the ARL PERFORM’X spectrometer is prepared to analyze unknown samples meaningfully as soon as it is installed at the customer’s site.
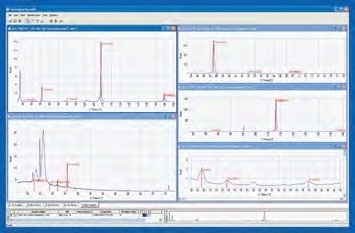
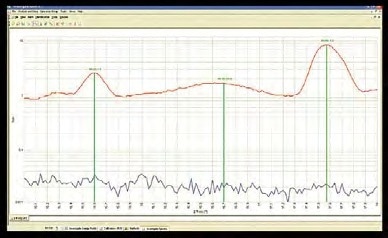
QuantAS software calculates concentrations of elements from F to U in a sample from these five scans. Image Credit: Thermo Fisher Scientific - Elemental and Phase Analysis
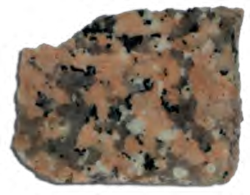
Typical QuantAS Results on a Mineral Sample
Longer counting time provides better limits of detection and determination of lighter elements, here fluorine. Source: Thermo Fisher Scientific - Elemental and Phase Analysis
| |
Duration of analysis |
| Element |
2 min 40 sec |
6 min 16 sec |
12 min 12 sec |
| CaO (%) |
42.8 |
43.1 |
42.8 |
| SiO2 (%) |
31.3 |
31.7 |
32.1 |
| Al2O3 (%) |
10.2 |
9.55 |
9.49 |
| MgO (%) |
5.12 |
5.06 |
5.10 |
| MnO (%) |
2.37 |
2.39 |
2.39 |
| SO3 (%) |
2.10 |
2.06 |
2.11 |
| K2O (%) |
1.80 |
1.63 |
1.71 |
| Na2O (%) |
1.42 |
1.22 |
1.26 |
| TiO2 (%) |
1.04 |
0.93 |
0.88 |
| Fe2O3 (%) |
0.96 |
0.95 |
0.93 |
| P2O5 (%) |
0.62 |
0.66 |
0.60 |
| V2O5 (%) |
0.21 |
0.21 |
0.21 |
| SrO (%) |
0.038 |
0.033 |
0.044 |
| ZrO2 (%) |
0.030 |
0.022 |
0.022 |
| La2O3 (%) |
— |
0.073 |
0.051 |
| Y2O3 (%) |
— |
0.025 |
0.025 |
| Cr2O3 (%) |
— |
— |
0.014 |
| F (%) |
— |
— |
0.092 |
UniQuant–Industry Leading Standard-Less Analyses
The optional UniQuant software utilizes the most potent and sophisticated Fundamental Parameters algorithms and is the most powerful standard-less XRF tool ever created. It is the best option for analyzing up to 79 elements in liquids and solids when standard samples are unavailable or only accessible in tiny amounts, with irregular forms, or with coatings.
The UniQuant program calculates peak and background intensities using 122 carefully chosen line locations. Additionally, it computes the equilibrium of unanalyzed components, such as organic and ultra-light components, present in the sample. It is possible to choose elements and their counting times, resulting in concentrations with the best detection limits in a matter of minutes.
The UniQuant software comes fully installed and calibrated by the manufacturer. Therefore, when the ARL PERFORM’X spectrometer is installed at the customer’s location, it is prepared to conduct an insightful examination of unidentified samples. Over time, stable samples are supplied for setup and upkeep.
Typical UniQuant Standard-Less Results
Traces in a geological sample. Source: Thermo Fisher Scientific - Elemental and Phase Analysis
| Element |
Chem (ppm) |
UniQuant (ppm) |
| Mn |
1310 |
1340 |
| Sr |
1100 |
1080 |
| F |
700 |
650 |
| Zr |
277 |
280 |
| V |
165 |
167 |
| Zn |
150 |
135 |
| Ni |
140 |
128 |
| Cr |
134 |
116 |
| Cl |
114 |
98 |
| S |
100 |
158 |
| Nb |
68 |
75 |
| Cu |
49 |
56 |
| Rb |
37 |
33 |
| Ga |
25 |
23 |
| Y |
22 |
18 |
| Sc |
15 |
10 |
Coatings on steel. Source: Thermo Fisher Scientific - Elemental and Phase Analysis
| |
Sample A |
Sample B |
| Element |
Given |
UniQuant |
Given |
UniQuant |
| Cr (mg/m2) |
1.9 |
2.1 |
8 |
8.4 |
| Sn (g/m2) |
11.5 |
10.9 |
4.97 |
4.92 |
UniQuant, the world's most renowned standard-less analysis package. Image Credit: Thermo Fisher Scientific - Elemental and Phase Analysis
UniQuant software uses up to 122 carefully selected line positions to determine peak and background intensities. Image Credit: Thermo Fisher Scientific - Elemental and Phase Analysis