Oxford Instruments’ EDS software, AZtecEnergy, includes the AutoPhaseMap module that automatically identifies areas of varied characteristic composition from X-ray map data, and ascertains the area, distribution, and constituent elements and composition of each of these phases or areas.
This article examines how this method can reveal formerly missed minor phases, even when their constituent elements are previously unknown in the sample.
AutoPhaseMap of Igneous Rock Sample
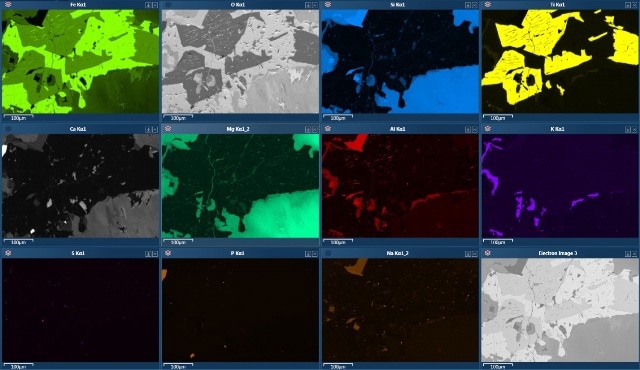
Figure 1. X-ray maps displayed automatically by the AZtecEnergy software
This study is based on an X-ray SmartMap of 1871 x 1234 resolution obtained over an area of the sample. For map acquisition, a high pixel resolution was selected because of the exceptionally large range of grain sizes within the specimen, which range from more than 1mm to almost 1µm. Figure 1 shows the X-ray maps detected automatically by the software.
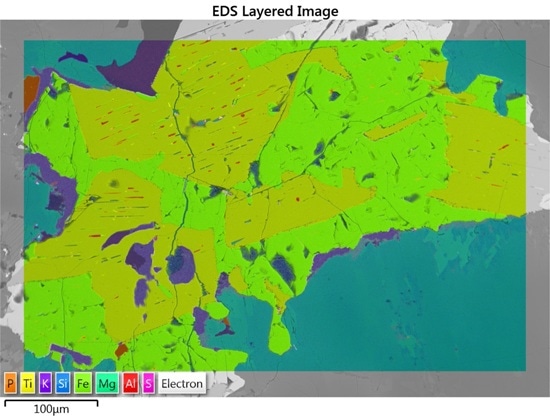
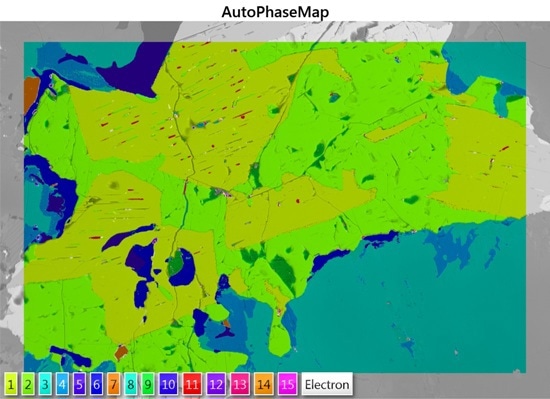
Figure 2. AutoPhaseMap calculation for the sample converts X-ray mapping data summarised in (a) the Layered Image into (b) an AutoPhaseMap dataset where each pixel is designated as a phase.
From the X-ray maps, a Layered Image (Figure 2a) was formed, integrating the data from eight of the element maps in varied colours to summarise the chemical distributions present in the sample.
Additionally, an AutoPhaseMap (Figure 2b) was determined from the data to find the phases present, their constituent elements, area fraction, and composition. It can be noted that the colours given to each phase corresponds to the hue in the Layered Image by default, thus phases with similar chemistry exhibit similar colours.
Table 1. Screenshot of the area fraction table for the phases identified by AutoPhaseMap.
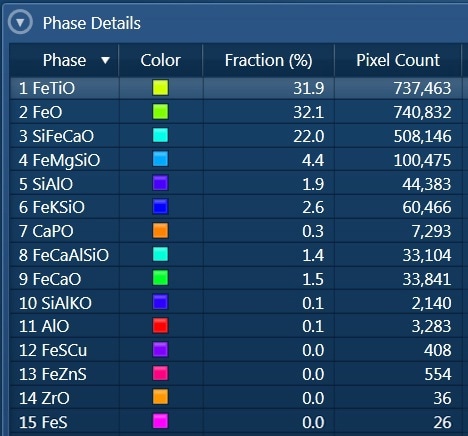
The 15 phases identified and their area fractions are illustrated in Table 1. On close inspection, these results reveal several minor phases, some with very low abundance, and emphasize elements that were not detected in the X-ray map list.
Detection of Minor Phases
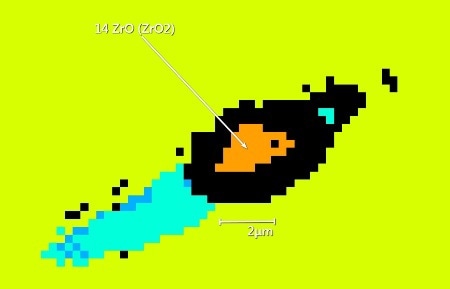
Figure 3. AutoPhaseMap image zoomed to focus on a grain of ZrO2 or baddelyite (orange). The black area around the grain represents pixels that have been rejected as they contain signals from ZrO2 and surrounding ilmenite (light green).
The phases detected by the AutoPhaseMap software contained some unanticipated minor phases with elements not formerly detected in the sample, including zinc (13 FeZnS), zirconium (14 ZrO), and copper (12 FeSCu). The number of pixels detected for these phases are very small. For instance, only 36 pixels are identified in 14 ZrO (Table 1), which on examination is found to be 1 grain having a size of only 2µm (Figure 3).
The spectrum from the phase has sufficient statistics to show that the mineral is baddelyite or ZrO2, which is quite rare in igneous rocks. The other minerals include ZnFeS2, FeCuS2, chalcopyrite, and sphalerite. X-ray maps rebuilt for these elements and quantified as TruMaps demonstrate that these elements only exist as extremely small grains and are of similar size to the 2µm baddelyite grain.
Conclusion
Besides detecting the main phases in a sample, the AutoPhaseMap software can be utilized to reveal and examine the phases in greater detail. It can inspect high image resolution data sets and has excellent sensitivity, thus making it suitable to identify phases present in small concentrations and as extremely small particle sizes, even if constituent elements are not known to be present in advance.

This information has been sourced, reviewed and adapted from materials provided by Oxford Instruments Nanoanalysis.
For more information on this source, please visit Oxford Instruments Nanoanalysis.