Oxford Instruments’ EDS software, AZtecEnergy, features the AutoPhaseMap module that automatically locates areas of varied characteristic composition from X-ray map data, and ascertains the constituent elements, area, distribution, and composition of each of these phases or areas.
This article explores how this method can be utilized to characterise the phases existing in an igneous rock. The results achieved are compared to the phase mapping results quantified from an EBSD dataset obtained concurrently with the EDS acquisition, to confirm the result of the AutoPhaseMap technique.
Phase Mapping and Identification
The sample obtained from an oceanic gabbro was polished but uncoated; data was obtained at a high tilt to enable concurrent collection of EBSD data. In order to reduce the charging effects, a variable vacuum was utilized. An X-ray SmartMap was obtained from an area of the sample under the conditions illustrated in the table below.
Table 1. Acquisition parameters for SmartMap Acquisition
| Accelerating Voltage (kV) |
20 |
| Sample tilt (°) |
70 |
| Map resolution |
259 x 228 |
| No of pixels |
59052 |
| Counts per pixel |
163 |
Chamber pressure (Pa)
|
20
|
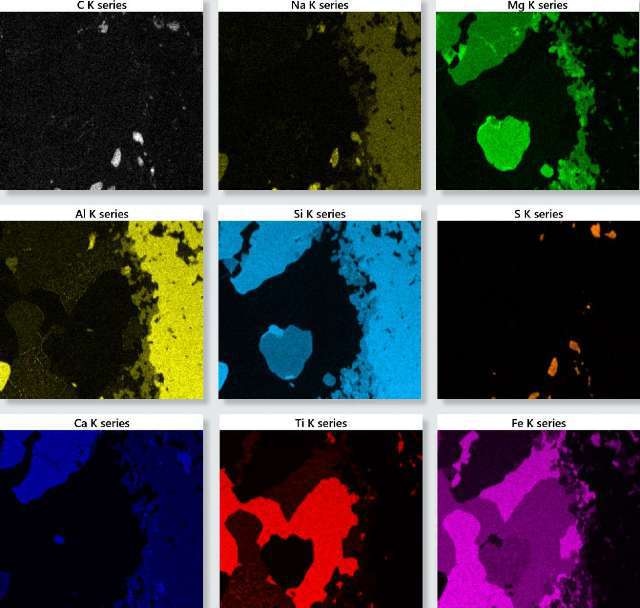
Figure 1. TruMap background and overlap corrected X-ray maps for the oceanic gabbro sample.
Figure 1 shows the X-ray maps for the important elements identified in the sample. These maps offer in-depth information about the elements’ distribution within the sample, and can be utilized to interpret the sample’s phase and chemical composition by reconstructing spectra from representative areas and deducing the quantitative results and constituent elements from this data.
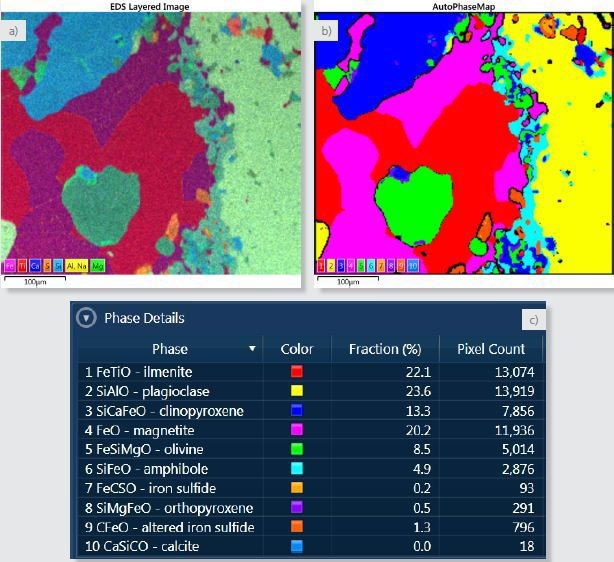
Figure 2. a) Layered image where X-ray maps for Fe, Ti, Ca, S, Si, Al and Na and Mg have been overlayed. b) AutoPhaseMap composite image showing the distribution of the identified phases. c) Phase details table showing the phases identified and the area fraction of each phase.
One way to make sample visualisation easier is to superimpose the X-ray maps to form a coloured “layered image” of the sample (Figure 2a). Through this image, the micro-structure and the overall phase distribution of the sample is depicted.
From the X-ray mapping data, AutoPhaseMap will determine areas of characteristic chemistry and ascertain their composition, spectrum, and distribution within a matter of seconds. These areas of different chemistry will match closely with the different phases in the sample. Figure 2b shows the calculated AutoPhaseMap.
The colour given to each phase is ascertained by the hue in the layered Image; this way the result can be easily related to the intensities and colours of the X-ray maps. Each phase is assigned a number illustrated in the colour key of the AutoPhaseMap and this matches with the phase number in the Phase Details table shown in Figure 2c.
By default, the AutoPhaseMap software gives a name to each phase; the names can easily be altered. In this case, mineral names have been given to each phase based on inspection of the composition and spectra of each phase.
Results and Discussion
The AutoPhaseMap software detected six major phases: two oxides (ilmenite and magnetite) and four silicates (clinopyroxene, plagioclase, amphibole and olivine). Reasonable compositions for the minerals can also be seen, in spite of the variable vacuum and the high tilt angle of the sample.
The software also found a large number of minor phases. In addition, a significant number of phases were also found with iron and sulphur with varying amounts of sodium, carbon, and oxygen. This possibly denotes an iron sulphide that has reacted later and modified to other phases. AutoPhaseMap also identified two small areas of a different carbon containing phase 10 CaSiCO.
If further contributions for the elements of these close minerals are considered, the main constituent elements for this phase will be calcium, carbon, and oxygen indicating a carbonate such as calcite, most probably the result of post formation chemical processes possibly related to those that changed the Iron sulfide.
Validation of AutoPhaseMap Result with EBSD Mapping
EBSD mapping is a well-known technique for phase analysis, examining the backscattered electron diffraction pattern created at each pixel location to distinguish the right phase among a set of possible crystal structures.
EBSD mapping detects phases much more directly when compared to the EDS-based characteristic chemistry AutoPhaseMap technique. Figure 3 shows the comparison of phase maps produced by the two techniques.
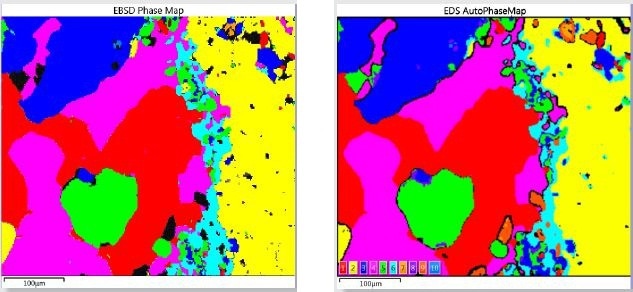
Figure 3. Comparison of Phase Mapping results obtained by EDS and EBSD for the simultaneous acquisition over an area of the oceanic gabbro sample.
| EBSD Phase |
Fraction (%) |
Legend |
EDS Phase |
Fraction (%) EDS |
| Ilmenite |
22.5 |
|
1 FeTiO - Ilmenite |
22.1 |
| Plagioclase (Bytownite) |
24.3 |
|
2 SiAlO - Plagioclase |
23.6 |
| Clinopyroxene (Diopside) |
13.2 |
|
3 SiCaFeO - Clinopyroxene |
13.3 |
| Magnetite |
21.7 |
|
4 FeO - Magnetite |
20.2 |
| Olivine (Forsterite) |
7.9 |
|
5 FeSiMgO - Olivine |
8.5 |
| Amphibole (Hornblende) |
5.3 |
|
6 SiFeO - Amphibole |
4.9 |
| Iron Sulfide (Pyrrhotite) |
0.12 |
|
7 FeCSO - Iron sulfide |
0.2 |
| Orthopyroxne (Enstatite) |
0.03 |
|
8 SiMgFeO - Orthopyroxene |
0.12 |
| |
0 |
|
9 CFeO - Altered iron sulfide |
1.3 |
| Calcite |
0.09 |
|
10 CaSiCO - Calcite |
0.03 |
Initially, the similarity of the results confirms the AutoPhaseMap result achieved; however, upon closer inspection, variations show the different strengths of the two techniques. Unlike EBSD, the advantage of the AutoPhaseMap technique is its relative insensitivity to surface preparation, for instance areas or phases which do not give patterns still exhibit characteristic chemistry.
Therefore, black areas in the EBSD map, which did not produce any patterns, are shown to be areas where modified olvine, orthopyroxene, and different states of alteration of iron sulfide have been identified by EDS. EBSD is mainly useful in validating more precisely phase identification.
Conclusion
The AutoPhaseMap software identifies the major phases present in the sample, and provides detailed information about constituent elements and composition and phase distribution. It quickly offers additional information on top of X-ray mapping data that can be utilized to gain a better understanding about the history of generation and modification of a sample.
EBSD has been employed to confirm the AutoPhaseMap result and demonstrates similar results which vary only in fine detail because of the different strengths of the two methods.