Lead (Pb) is extremely toxic to living organisms, prompting this element to be phased out of an array of products.
However, Pb is still frequently employed in a number of applications, most notably alloys, lead-acid batteries, radiation shielding, ammunition, flashing in the construction industry and as lining in industrial pipes and baths designed to carry corrosive substances.
To accommodate this wide range of uses, an equally wide range of grades and purity levels of lead are produced. The London Metal Exchange is responsible for issuing specifications for an array of different metals in several grades.
This article explores the use of the analysis of lead of different purities with PerkinElmer’s Avio® 550 Max fully simultaneous ICP optical emission spectrometer (ICP-OES). It uses the “Special Contract Rules for Standard Lead1” for guidance on analytes and concentrations.
Experimental
Samples
Analyses were performed in 1% solutions of Pb in order to simulate digests that have been diluted 100x with 5% nitric acid (v/v). Elemental spikes were added to the 1% Pb solution at the levels set in the “Special Contract Rules for Standard Lead.” This was done to confirm accuracy.
Calibration standards were generated using 5% HNO3 at 50, 100 and 200 ppb in 1% Pb solutions. The “Method of Additions – Sample Intercept” section of the guidance (Figure 1) was employed as the calibration scheme in order to mitigate any matrix effects in the plasma.
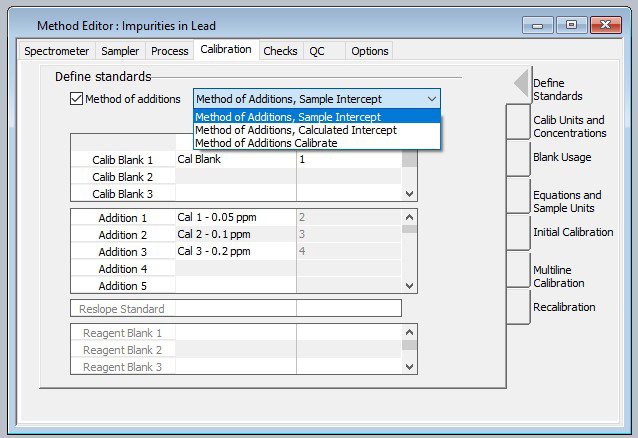
Figure 1. The Method Editor in Syngistix™ software provides a check box to enable method of additions along with pull-down selection of sample intercept, calculated intercept and calibrate calibrations schemes. Image Credit: PerkinElmer
Instrumentation
All analyses were conducted using the Avio 550 Max ICP-OES. The parameters used are provided in Table 1, while the analytes and wavelengths used are provided in Table 2. The standard sample introduction parameters and configuration were utilized for each analysis, and the torch position was set at -4.
Table 1. Avio 550 Max ICP-OES Instrumental Parameters and Conditions. Source: PerkinElmer
| Parameter |
Value |
| Nebulizer |
MEINHARD® K-1 |
| Spray Chamber |
Baffled glass cyclonic |
| RF Power |
1500 W |
| Injector |
2.0 mm ceramic |
| Plasma Gas Flow |
8 L/min |
| Aux Gas Flow |
0.2 L/min |
| Nebulizer Gas Flow |
0.60 L/min |
| Torch Position |
-4 |
| Sample Uptake Rate |
1.0 mL/min |
| Sample Uptake Tubing |
Black/Black (0.76 mm id) |
| Internal Standard Tubing |
Green/Orange (0.38 mm id) |
| Drain Tubing |
Red/Red (1.14 mm id) |
| Replicates |
3 |
| Plasma View |
Axial |
Table 2. Elements and Wavelengths. Source: PerkinElmer
| Element |
Wavelength (nm) |
| Ag |
243.778 |
| As |
193.696 |
| Bi |
223.061 |
| Cd |
214.440 |
| Cu |
327.393 |
| Fe |
259.939 |
| Ni |
221.648 |
| Sb |
231.146 |
| Sn |
189.927 |
| Zn |
206.200 |
| Sc (int std) |
361.383 |
A combination of the Avio 550 Max’s simultaneous analysis and its minimal argon consumption (9 L/min total) affords users significant savings, particularly when taking into account the cost of argon.
Results and Discussion
The London Metal Exchange provides a number of different specifications for Pb. This case study focused on 99.97% and 99.985% Pb specifications for BS EN 12659:1999 (Lead and Lead Alloys) and GB/T 469-2005 (Lead Ingots) (Table 3).
Table 3. Specifications for Pb Purities Used in this Work. Source: PerkinElmer
| |
BS EN 12659:1999 (Lead and Lead Alloys) |
GB/T 469-2005 (Lead Ingots) |
| |
99.97% |
99.985% |
99.97% |
99.985% |
| Element |
Concentration
(wt %) |
Concentration
(wt %) |
Concentration
(wt %) |
Concentration
(wt %) |
| Ag |
0.005 |
0.0025 |
0.005 |
0.0025 |
| As |
0.001 |
0.0005 |
0.001 |
0.0005 |
| Bi |
0.03 |
0.015 |
0.03 |
0.015 |
| Cd |
0.001 |
0.0002 |
0.001 |
0.0002 |
| Cu |
0.003 |
0.001 |
0.003 |
0.001 |
| Fe |
--- |
--- |
0.002 |
0.001 |
| Ni |
0.001 |
0.0005 |
0.001 |
0.0005 |
| Sb |
0.001 |
0.0005 |
0.001 |
0.0008 |
| Sn |
0.001 |
0.0005 |
0.001 |
0.0005 |
| Zn |
0.0005 |
0.0002 |
0.0005 |
0.0004 |
Table 4. Analyte Spike Levels in 1% Lead. Source: PerkinElmer
| Element |
Spike Levels (mg/L) |
| Ag |
0.25, 0.5 |
| As |
0.05, 0.1 |
| Bi |
1.5, 3 |
| Cd |
0.02, 0.1 |
| Cu |
0.1, 0.3 |
| Fe |
0.1, 0.2 |
| Ni |
0.05, 0.1 |
| Sb |
0.05, 0.08, 0.1 |
| Sn |
0.05, 0.1 |
| Zn |
0.02, 0.04, 0.05 |
The analytes were spiked into 1% Pb solutions at the concentrations outlined in Table 4 in order to assess the instrument’s ability to conduct accurate measurements at these levels. This accounted for a 100x dilution for sample preparation; for example, pure lead diluted 100x before analysis.
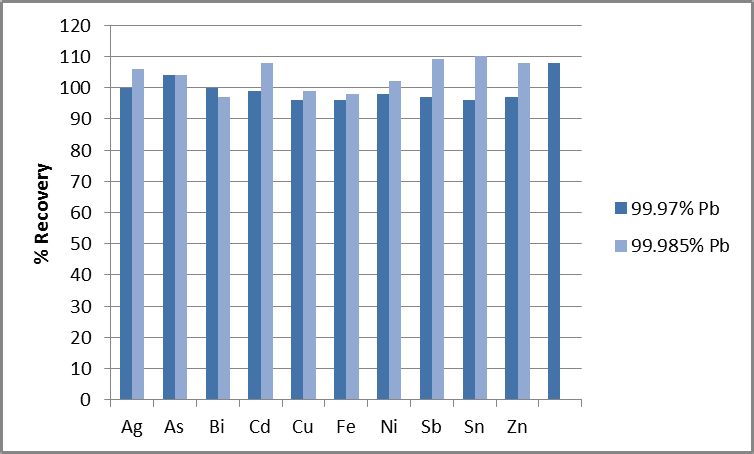
Figure 2. % Recoveries of analytes in 1% Pb, spiked at the 99.97% and 99.985% limits. Image Credit: PerkinElmer
The plot shown in Figure 2 confirms that elements at each of the four different specifications shown in Table 3 recover within 10% of their true values. This demonstrates the methodology’s accuracy.
Spectral interferences on Sn and Zn required the application of a Multicomponent Spectral Fitting (MSF) model2 to remove the effects of the interferences, facilitating accurate results at each purity level.
Elements were spiked into 1% Pb at 20 µg/L, the equivalent of 0.0002 wt%, in order to determine the instrument’s ability to measure even lower concentrations in 1% Pb.
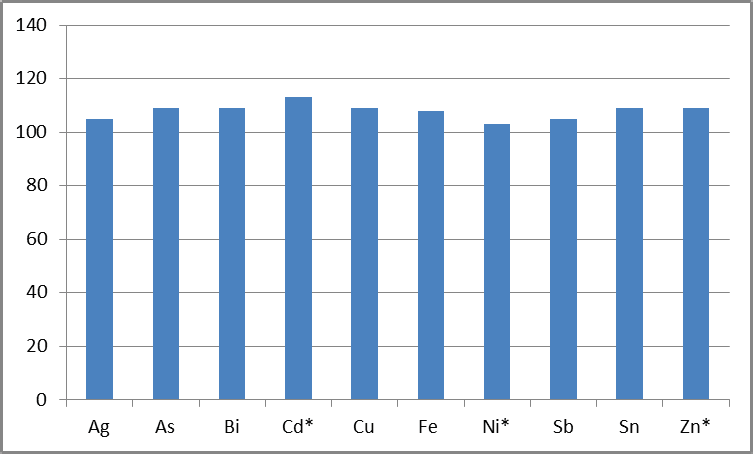
Figure 3. % Recoveries of analytes in 1% Pb, spiked at 0.020 mg/L, representing 0.0002 wt% (* = elements specified at 0.0002 wt% in 99.985% Pb). Image Credit: PerkinElmer
This concentration is either at or below the specifications for 99.990% and 99.994% Pb (Table 5).1 Figure 3 shows the recoveries, robustly demonstrating the methodology’s suitability for accurately measuring these lower concentrations.
Table 5. Specifications for 99.990 and 99.994% Lead (units in wt%). Source: PerkinElmer
| Element |
BS EN Lead and
Lead Alloys: 99.990% |
GB/T Lead
Ingots: 99.994% |
| Ag |
0.0015 |
0.0008 |
| As |
0.0005 |
0.0008 |
| Bi |
0.0100 |
0.004 |
| Cd |
0.0002 |
--- |
| Cu |
0.0005 |
0.001 |
| Fe |
--- |
0.0005 |
| Ni |
0.0002 |
--- |
| Sb |
0.0005 |
0.0008 |
| Sn |
0.0005 |
0.0005 |
| Zn |
0.0002 |
0.0004 |
With the methodology’s accuracy confirmed, its stability was assessed by observing the internal standard signal over a 6 hour analysis of 1% Pb.
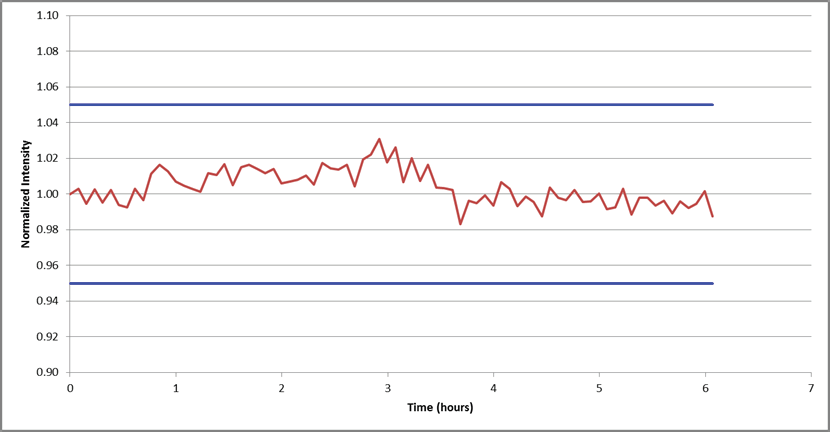
Figure 4. Internal standard (Sc) stability over a 6-hour analysis of 1% Pb. All data is normalized to the first reading. Image Credit: PerkinElmer
Results of this observation are plotted in Figure 4, revealing a variation of less than + 3% over 6 hours when normalized to the first reading. This confidently demonstrates the methodology’s stability.
Conclusions
The case study and experiments outlined above clearly show the Avio 550 Max ICP-OES’s ability to analyze solutions of 1% Pb. It can perform this successfully for elements at levels specified by the London Metal Exchange for purities ranging from 99.97% to 99.994%.
While the high matrix concentration led to spectral interferences for a handful of the elements, MSF can be employed to overcome these, allowing each of the specified elements to be measured at its required concentrations.
The Avio 550 Max fully simultaneous ICP-OES is more than capable of measuring traces in lead to meet the London Metal Exchange requirements.
References
- “Special Contract Rules for Standard Lead,” The London Metal Exchange.
- “Multicomponent Spectral Fitting,” Technical Note, PerkinElmer, 2017.
Consumables Used
Table 6. Source: PerkinElmer
| Component |
Part Number |
Sample Uptake Tubing,
Black/Black (0.76 mm id), PVC |
N0777043 (flared)
09908587 (non-flared) |
Drain Tubing, Red/Red
(1.14 mm id), PVC |
09908585 |
Internal Standard Tubing,
Orange/Green (0.38 mm id), PVC |
N0773111 (flared) |
| Antimony Standard, 1000 mg/L |
N9300207 (125 mL)
N9300101 (500mL) |
| Arsenic Standard, 1000 mg/L |
N9300180 (125 mL)
N9300102 (500 mL) |
| Bismuth Standard, 1000 mg/L |
N9303761 (125 mL)
N9300105 (500 mL) |
| Cadmium Standard, 1000 mg/L |
N9300176 (125 mL)
N9300107 (500 mL) |
| Copper Standard, 1000 mg/L |
N9300183 (125 mL)
N9300114 (500 mL) |
| Iron Standard, 1000 mg/L |
N9303771 (125 mL)
N9300126 (500 mL) |
| Nickel Standard, 1000 mg/L |
N9300177 (125 mL)
N9300136 (500 mL) |
| Scandium Standard, 1000 mg/L |
N9303798 (125 mL)
N9300148 (500mL) |
| Silver Standard, 1000 mg/L |
N9300171 (125 mL)
N9300151 (500 mL) |
| Tin Standard, 1000 mg/L |
N9303801 (125 mL)
N9300161 (500mL) |
| Zinc Standard, 1000 mg/L |
N9300178 (125 mL)
N9300168 (500 mL) |
| Autosampler Tubes |
B0193233 (15 mL)
B0193234 (50 mL) |

This information has been sourced, reviewed and adapted from materials provided by PerkinElmer.
For more information on this source, please visit PerkinElmer.