Analysing geological materials is challenging because of their matrix composition, and the process of preparing samples requires the conversion of samples into a solution. The preparation of samples varies depending on the type of sample, and the elements of interest.
Lithium fusion is the most commonly used sample preparation technique for geological samples. The fusion process involves mixing the sample with excess lithium borate, heating until the lithium borate melts, and then dissolving the sample to form a homogenous mass. The resulting solid is then finally dissolved in acid for analysis.
Fusion samples contain high concentrations of Group I elements, such as lithium (Li), sodium (Na), and potassium (K). These elements mean fusion samples are some of the most punishing for an ICP-OES sample introduction system. The high salt concentrations from the fusion preparation process can cause signal drift as salts deposit on the nebulizer and injector.
Additionally, high concentrations of Group I elements can also result in rapid devitrification of the quartz torch. These issues can make recording precise and accurate results over long periods of analyses challenging. However, it is possible to mitigate these issues if the sample introduction components are carefully considered.
This article describes the analysis of fusion samples, leveraging the PerkinElmer Avio® 550 Max fully simultaneous ICP-OES, whilst focusing on the long-term stability of the system.
Experimental
Samples
Ore samples with high concentrations of silicon dioxide, aluminum oxide, calcium oxide, magnesium oxide, and manganese (Mn), were prepared using a standard lithium metaborate fusion procedure. Once the fusion was complete, the resultant mass was dissolved in 5% nitric acid (v/v) for analysis. The dissolved solid content of the samples is 3.5 weight percent.
All measurements were taken against calibration curves of two known in-house reference materials, which had undergone lithium fusion sample preparation. Yttrium (Y) was added to all standards and samples as an internal standard.
Instrumental Conditions
All analyses were conducted on an Avio 550 Max ICP-OES (PerkinElmer Inc., Shelton, Connecticut, USA) using the parameters and conditions outlined in Table 1, and the wavelengths and analytes in Table 2. As a result of the high dissolved solid content of the samples, a SeaSpray™ nebulizer with an Elegra™ argon humidifier was used to prevent nebulizer clogging, as well as reduce the formation of deposits on the injector tip.
Table 1. Avio 550 Max ICP-OES Conditions and Parameters. Source: PerkinElmer
| Component/Parameter |
Description/Value |
| Nebulizer |
SeaSpray™ |
| Argon Humidifier |
Elegra™ |
| Spray Chamber |
Twister baffled cyclonic |
| Torch |
D-Torch, ceramic |
| Injector |
1.2 mm id, tapered, alumina |
| RF Power |
1500 W |
| Torch Position |
-4.5 |
| Sample Uptake Rate |
0.7 mL/min |
| Read Time |
1 sec/analyte |
In addition to the SeaSpray™ nebulizer, which is highly resistant to clogging, the Elegra™ argon humidifier was used. This would further reduce any signal drift caused by matrix deposition in the nebulizer or injector. High dissolved solid content can also result in deposits on the torch, leading to devitrification and instability.
A ceramic torch was used to combat devitrification, as well as a 1.2 mm injector to reduce plasma loading. The Avio 550 Max's is highly sensitivity, meaning the reduction in sample introduced to the plasma did not affect the data quality.
Table 2. Analytes and Wavelengths. Source: PerkinElmer
| Element |
Wavelength (nm) |
Plasma View |
| Si |
251.612 |
Radial |
| Al |
308.211 |
Radial |
| Ca |
317.925 |
Radial |
| Mg |
285.212 |
Radial |
| Mn |
257.608 |
Radial |
| Y (internal Standard) |
371.029 |
Radial |
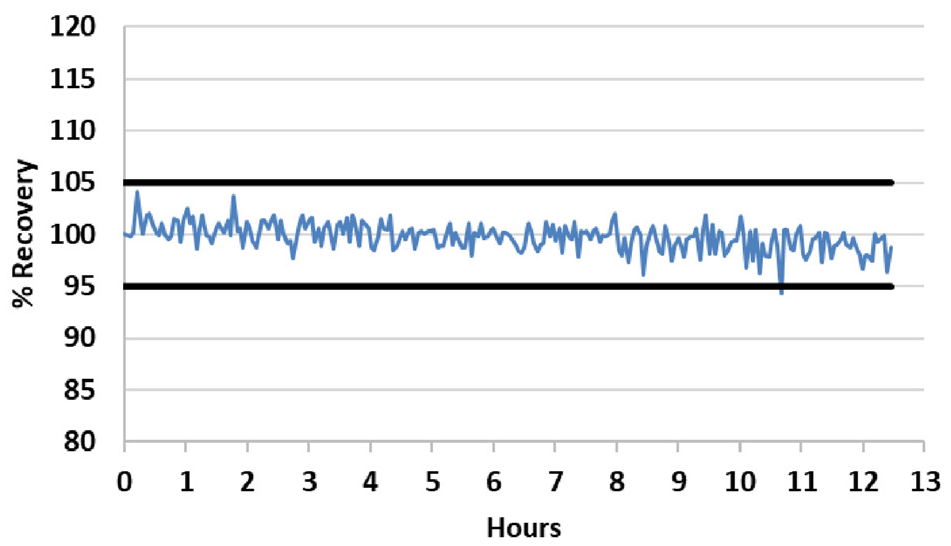
Figure 1. Internal standard stability over a 12.5-hour run of fusion samples. All results are normalized to the first sample. The black bars represent 95% and 105% recoveries. Image Credit: PerkinElmer
Results and Discussion
To test for stability, the internal standard signal was measured in all fusion samples across a 12.5- hour run, and normalized to the first sample. The results (Figure 1) demonstrate the excellent stability, with 92% of the readings within 2% of the initial reading; the remaining 8% of the recoveries are within 5% of the initial reading. The results evidence the remarkable long-term stability of the system, even in the presence of high total dissolved solid (TDS) samples.
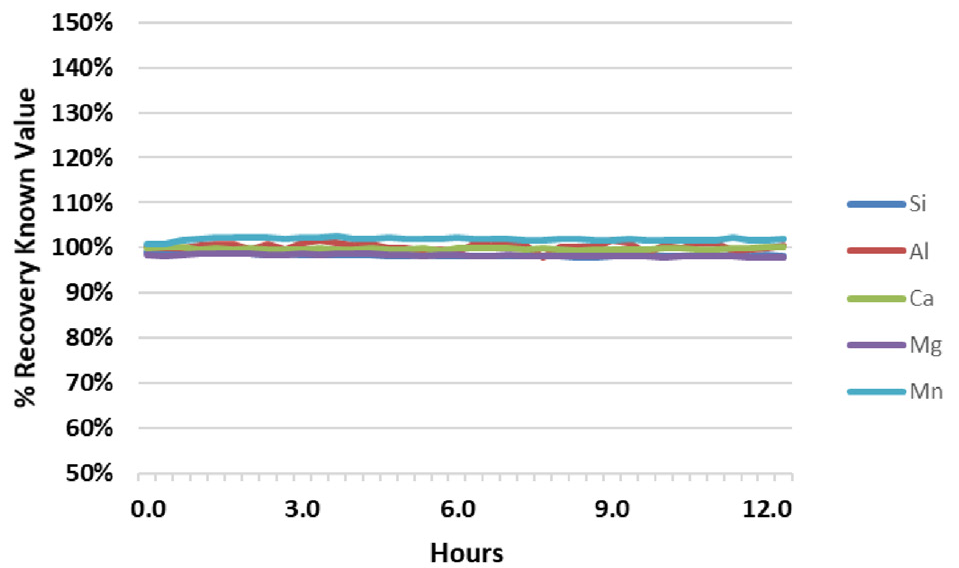
Figure 2. Analyte recovery in QC Standard 1 during a 12.5-hour analysis of fusion samples. Image Credit: PerkinElmer
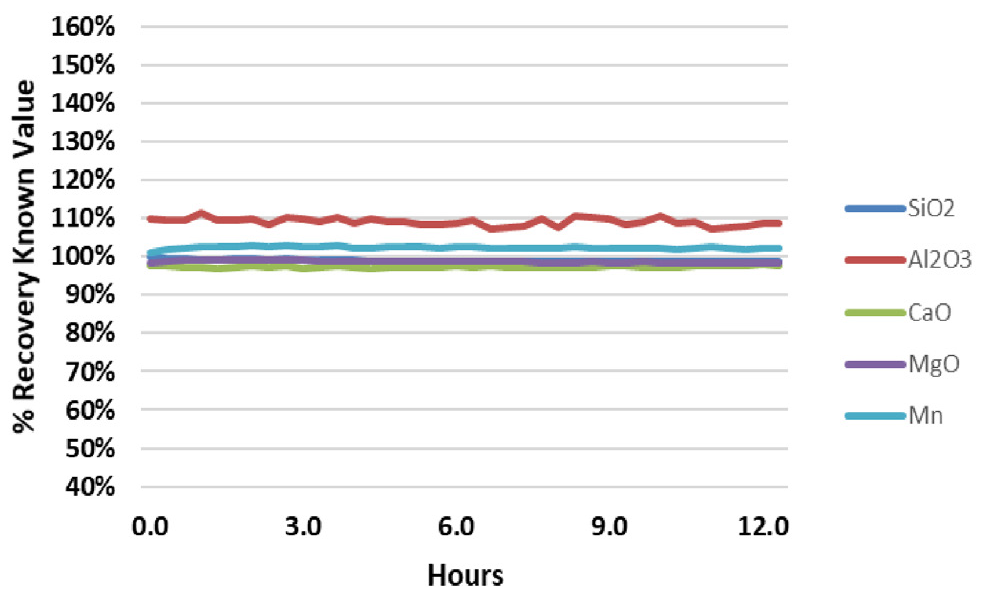
Figure 3. Analyte recovery in QC Standard 2 during a 12.5-hour analysis of fusion samples. Image Credit: PerkinElmer
Results from the two in-house QC samples from the same run (Figures 2 and 3) are further evidence of the stability of the system. During the analytical run, the QC samples were analyzed every six samples. For the QC standards, all recoveries for all analytes are within + 3% of their true value, with the exception of Al in QC Standard 2, which consistently recovers around 110%.
These results demonstrate the exceptional accuracy of the methodology, and show that Al contamination is present in QC Standard 2. The relative standard deviations (RSDs) for the results over the 12.5-hour analysis are also illustrated (Figure 2 and 3). With RSDs less than 1% for all elements, the high salt content of the samples does not affect the stability of the system.
The Elegra™ argon humidifier, along with a SeaSpray™ nebulizer, a baffled cyclonic spray chamber, a narrow bore injector, and ceramic torch minimize salt deposition in the sample introduction components, allow high TDS samples to be analyzed over 12.5 hours without issues.
The Avio 550 Max's PlasmaShear™ technology also contributes to this stability by producing a thin jet of air which cuts off the top of the plasma (Figure 4), preventing matrix deposition on the entrance to the axial sampling window of the spectrometer. However, despite measurements being recorded in radial mode, deposition on the axial window could still affect stability if the matrix components became dislodged, and fell into the torch during analysis.
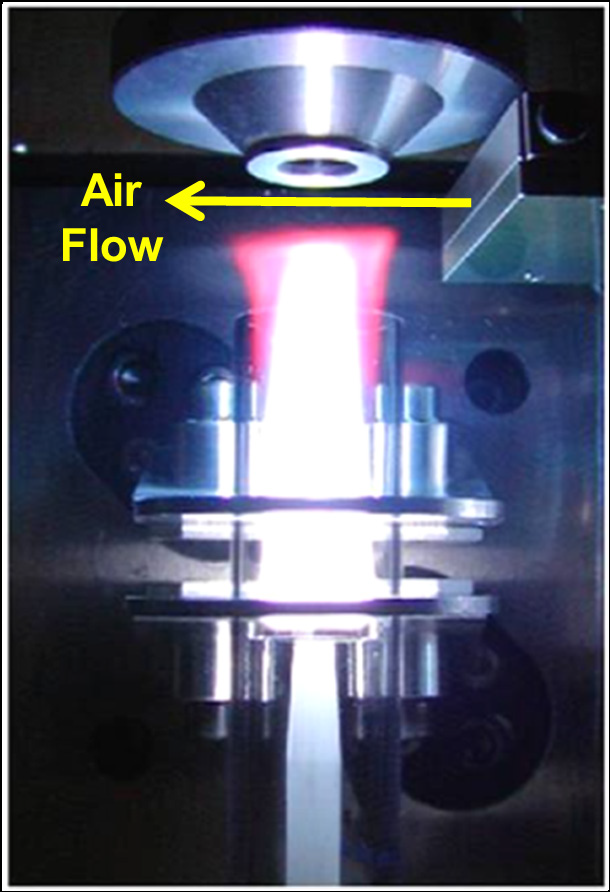
Figure 4. PlasmaShear technology in the Avio 550 Max ICP-OES cutting off the top of the plasma, preventing deposition on the interface window. Image Credit: PerkinElmer
Conclusion
This work has evidenced clearly the ability of the Avio 550 Max fully simultaneous ICP-OES to provide accurate, reproducible results of fusion samples over extensive periods of analyze. Despite the potential for high TDS content fusion samples to cause operational issues during extended analyses, the Avio’s PlasmaShear system – along with an Elegra™ argon humidifier, SeaSpray™ nebulizer, baffled cyclonic spray chamber, narrow bore injector, and ceramic torch – mitigates against the effect of high TDS, allowing accurate, stable results when analyzing high-TDS samples.
Acknowledgements
Produced from material originally authored by Stan Smith, PerkinElmer., Inc. (Shelton, CT).
References
- All Matrix Solution System for NexION ICP-MS Platforms, PerkinElmer Technical Note, 2017.
- Advantages of a Novel Interface Design for NexION 5000 ICP-MS, PerkinElmer Technical Note, 2020.
- Advantages of a Novel Plasma Generator for the NexION 1000/2000/5000 ICP-MS Systems, PerkinElmer Technical Note, 2020.
Consumables Used
Table 3. Source: PerkinElmer
| Component |
Part Number |
Sample Uptake Tubing,
Black/Black (0.76 mm id), PVC |
N0777043 (flared)
09908587 (non-flared) |
Drain Tubing, Red/Red
(1.14 mm id), PVC |
09908585 |
| SeaSpray™ Nebulizer |
N0811307 |
| Elegra™ Argon Humidifier |
N0781598 |
| Ceramic D-Torch |
N0811912 |
| 1.2 mm Tapered Alumina Injector |
N0791181 |
| Autosampler Tubes |
B0193233 (15 mL, box of 500)
B0193234 (50 mL, box of 500) |

This information has been sourced, reviewed and adapted from materials provided by PerkinElmer.
For more information on this source, please visit PerkinElmer.