Several definitions determine what constitutes a complex ore. In its most basic form, the term may refer to an ore in which more than one value element must be recovered, e.g., copper and gold. It may also indicate costly ores due to a deleterious element being present, e.g. high arsenic in a gold deposit.
Ores that are difficult to treat are being exploited on an increased basis due to the complexity of their mineral compositions, limited liberation of target minerals, and fine granularity. These are the complex ores referred to in this article.
Societal, environmental, and technical influences are leading to an increase in the demand for key technical commodities. Simultaneously, there is a decrease in the availability of easily extractable ores, requiring refinements in the extraction of target minerals to meet supply chain demands and extend the sustainable use of mineral resources.
Efficient beneficiation of complex ores requires a comprehensive analysis of the ore that goes way beyond knowledge of mineralogy alone and typically involves numerous techniques, such as X-ray diffraction (XRD), X-ray fluorescence (XRF), and some form of liberation analysis.
ZEISS Mineralogic (ML) in 2D and 3D delivers a wealth of information relevant to processing complex ores, without necessarily employing other analytical techniques.
ML exceeds what basic descriptions of the mineralogy, chemical composition, and liberation offer and provides detailed insights relevant to processing decisions in the beneficiation of ore.
Technology: ZEISS Mineralogic 2D Method
Utilizing EDS detectors for precise chemical analysis has been validated time and time again to demonstrate that, within its physical detection limit of 1000 ppm per point analyzed, EDS is just as precise as WDS for the compositions of minor and major elements.1,2
ML is a dynamic system that was developed with analytical precision and flexibility in mind. Any imaging detector (SE, BSD, CL, etc) can be deployed in combination or as a stand-alone system to define the area of analysis before conducting quantitative chemical analysis to automatically classify mineral phases based on their chemical composition, and supply detailed outputs on morphology, chemistry, and textural parameters.
ML far exceeds other automated mineralogy packages in both application and theory. The quantified chemical analysis, in combination with state-of-the-art image processing and analysis, ensures ML goes beyond being a petrographical tool capable of describing mineralogy to a petrological tool that delivers particle descriptions and interpretation parameters that previously required complex and expensive post-processing procedures.
The result is a novel, one-stop-shop solution for process mineralogy that offers detailed chemical and mineralogical information without having to fall back on, for example, XRD and XRF. During analysis, each spectrum is deconvoluted, meaning ML offers a bulk chemical composition of the sample.
The technology prevents the use of more expensive second techniques such as XRF or the electron microprobe (EMP). It also offers insights not normally available when deciding on a beneficiation process. The analyses reported in this article were conducted using an ML system that incorporated ZEISS’s Sigma 300 Scanning Electron Microscope (SEM) equipped with 2 x Oxford Ultim Max 65mm2 EDS detectors.
Analysis speed is boosted by the use of the Oxford Ultim Max range of EDS detectors, which also enhances the chemical analytical resolution offered by ML. The Ultim Max EDS detectors have been developed with a focus on accuracy and ease-of-use under all analytical conditions, including at the extremely high count rates typically used in automated mineralogy.
Oxford Instruments produces TruQ spectrum processing technology, which incorporates a series of algorithms dedicated to process and quantify every spectrum in real time to ensure that appropriate results are acquired every time. A high level of confidence can be attached to the results without conducting a manual review of the spectra acquired (Figure 1).
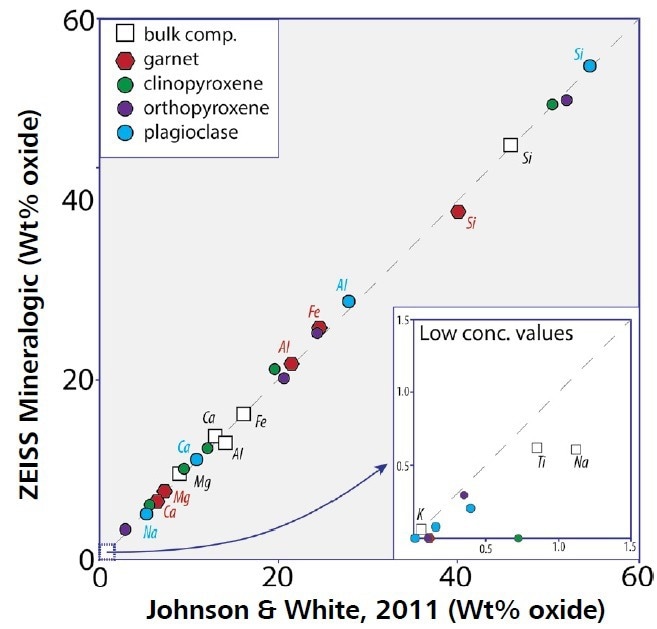
Figure 1. Comparison of geochemistry from Johnson and White and ZEISS Mineralogic chemistry for the Scouriemore metagabbro. Plot comparing the average mineral chemistry for the major silicate phases (colored symbols) and the bulk rock chemistry (open squares) between the two studies. The data show that ZEISS Mineralogic provides a 1:1 correlation with the mineral chemistry determined by EPMA, and the bulk rock chemistry determined by XRF. Image Credit: ZEISS Raw Materials Group
The Sample: Description
A milled powder was prepared as a 30 mm metallographic block for the sample material. It is primarily composed of barite (~58% by area), carbonates, dolomite (~20% by area), and Fe-oxides, primarily hematite and goethite (~11% by area) as shown in Table 1 and Figure 2.
Table 1. Bulk sample data providing the number of instances of each phase, the proportion of the area they represent, the proportion of weight they represent, the average particle size, the deviation of said average, and the average chemical composition of each phase based on the total of analyses of said phase. Details for each spot analyzed and phase measured are available in the database for further interrogation. Source: ZEISS Raw Materials Group
| |
Number |
Area % |
Weight % |
Grain Size (μm) |
Grain Size Std Dev (μm) |
Average Composition |
| Barite |
11880 |
57.5 |
64.7 |
81.4 |
77.5 |
Ba 62.57; O 22.91; S 14.51 |
| Dolomite |
4015 |
17.5 |
12.5 |
66.1 |
94.9 |
O 51.88; Ca 28.7; Mg 13.36; Fe 6.06 |
| Hematite |
15705 |
10.1 |
10.4 |
21.5 |
39.0 |
Fe 69.82; O 27.55; Mn 1.25; Al 0.69; Si 0.39; P 0.23; Ba 0.04; Ca 0.01; Ce 0.01 |
| Synchysite |
5966 |
2.7 |
2.6 |
18.1 |
30.1 |
O 34.69; Ce 31.22; Ca 14.49; La 12.23; Nd 5.09; Fe 2.09; F 0.15; Pr 0.03 |
| Goethite-REE |
17320 |
1.3 |
1.3 |
9.3 |
11.3 |
Fe 43.98; O 33.34; Ce 9.25; Si 4.34; La 3.09; Nd 2.14; Al 1.61; Mn 0.81; P 0.67;
Dy 0.56; Eu 0.11; F 0.03; Pr 0.02; Ba 0.02; Er 0.02 |
| Lanthanite (Ce) |
5399 |
0.5 |
0.4 |
12.1 |
12.5 |
Ce 41.98; La 23.29; O 22.88; Nd 9.41; Fe 2.35; Pr 0.08; F 0.01 |
| Lanthanite (La) |
3971 |
0.4 |
0.3 |
11.5 |
13.5 |
La 35.56; O 24.99; Nd 21.18; Ce 15.3; Fe 2.82; Pr 0.13; F 0.01; Ca 0.01 |
| Barite REE |
7132 |
0.2 |
0.3 |
5.8 |
2.9 |
Ba 53.05; O 19.84; S 13.44; Ce 9.89; La 2.47; Nd 1; Eu 0.11; Tm 0.06; Ho 0.05;
Dy 0.03; Pr 0.02; Gd 0.02; Yb 0.01; Lu 0.01 |
| Monazite (La) |
987 |
0.1 |
0.2 |
13.1 |
17.2 |
O 43.58; La 26.93; Nd 15.51; P 13.19; Ce 0.75; Pr 0.04 |
| Cerianite |
5917 |
0.5 |
0.1 |
11.1 |
12.1 |
Ce 63.02; O 26.31; Fe 10.65; Pr 0.01; La 0.01 |
| Aeschynite (Nd) |
1723 |
0.1 |
0.1 |
7.1 |
6.0 |
O 36.41; Nd 26.4; La 23.03; Nb 5.65; Ca 3.69; Ti 3.27; Fe 1.34; S 0.19 |
| Monazite (Nd) |
1033 |
0.1 |
0.1 |
8.4 |
7.5 |
O 41.94; Nd 25.62; La 17.19; P 13.52; Ce 1.31; Pr 0.43 |
| Lanthanite (Nd) |
1955 |
0.1 |
0.1 |
7.2 |
5.1 |
Nd 33.26; O 28.28; La 28.23; Ce 4.91; Fe 4.8; Pr 0.51; Sm 0.01 |
| Monazite (Ce) |
605 |
0.03 |
0.04 |
7.8 |
6.6 |
O 44; Ce 37.27; P 11.57; La 3.69; Nd 3.46 |
| Bastnasite (La) |
476 |
0.02 |
0.02 |
6.0 |
3.4 |
La 35.72; Nd 23.43; O 22.5; F 10.66; Ce 7.5; Fe 0.09; Pr 0.08; Sm 0.02 |
| Bastnasite (Ce) |
307 |
0.01 |
0.01 |
6.5 |
3.2 |
Ce 36.31; La 23.78; O 20.28; F 10.7; Nd 8.84; Fe 0.07; Pr 0.03 |
| Bastnasite (Nd) |
105 |
0.003 |
0.004 |
6.1 |
3.3 |
Nd 33.9; La 28.36; O 23.46; F 11.36; Ce 2.35; Pr 0.58 |
| NdO(CH?) |
119 |
0.003 |
0.004 |
5.1 |
0.6 |
Nd 81.8; O 18.2 |
| Quartz |
641 |
3.3 |
2.2 |
73.2 |
99.0 |
Si 50.65; O 49.34; Al 0.01 |
| Ankerite |
26089 |
2.0 |
1.5 |
10.5 |
11.2 |
O 46.82; Ca 26.51; Fe 18.34; Mg 8.34 |
| Calcite |
9992 |
1.7 |
1.1 |
9.9 |
20.5 |
O 56.59; Ca 42.69; Fe 0.46; Mg 0.25; Mn 0.01 |
| Bixbyite |
1338 |
0.6 |
0.7 |
21.6 |
30.7 |
Mn 55.55; O 30.32; Fe 14.13 |
| Siderite |
16793 |
0.6 |
0.6 |
6.9 |
4.2 |
Fe 56.75; O 34.58; Ca 5.9; Mg 1.5; Mn 1.01; Si 0.27 |
| Titanomagnetite |
3918 |
0.2 |
0.3 |
8.3 |
8.5 |
Fe 74.23; O 23.25; Ti 2.51 |
| Ferrihollandite |
2842 |
0.2 |
0.2 |
8.7 |
8.9 |
Fe 40.4; O 26.01; Mn 23.75; Ba 9.83 |
| Pseudobrookite |
2664 |
0.2 |
0.2 |
9.5 |
9.3 |
Fe 57.51; O 31.27; Ti 11.22 |
| Ilmenite |
975 |
0.1 |
0.1 |
9.7 |
11.2 |
O 38.17; Ti 37.68; Fe 24.09; Mn 0.06 |
| Alumohematite |
836 |
0.03 |
0.04 |
5.8 |
3.6 |
Fe 72.78; O 23.04; Al 4.18 |
| Apatite |
78 |
0.04 |
0.03 |
18.3 |
25.2 |
Ca 43.2; O 38.01; P 18.72; Al 0.04; F 0.03 |
| Sepiolite |
676 |
0.03 |
0.02 |
7.6 |
6.6 |
O 63.85; Si 22.12; Mg 14.03 |
| Rutile |
170 |
0.01 |
0.02 |
10.6 |
10.3 |
Ti 53.14; O 42.54; Fe 4.32 |
| Alumomagnetite |
313 |
0.01 |
0.01 |
5.4 |
2.0 |
Fe 78.54; O 16.97; Al 4.49 |
| Pyrite |
21 |
0.01 |
0.01 |
16.8 |
30.3 |
S 51.47; Fe 47.94; O 0.52; Cl 0.08 |
| Columbite- Fe |
172 |
0.01 |
0.01 |
6.9 |
4.2 |
Nb 44.31; O 35.1; Fe 20.59 |
| K-feldspar |
37 |
0.005 |
0.003 |
11.8 |
11.2 |
O 44; Si 31.53; K 13.77; Al 10.7 |
| Hollandite |
24 |
0.001 |
0.001 |
5.2 |
1.0 |
O 55.5; Mn 28.81; Ba 14.58; Fe 1.11 |
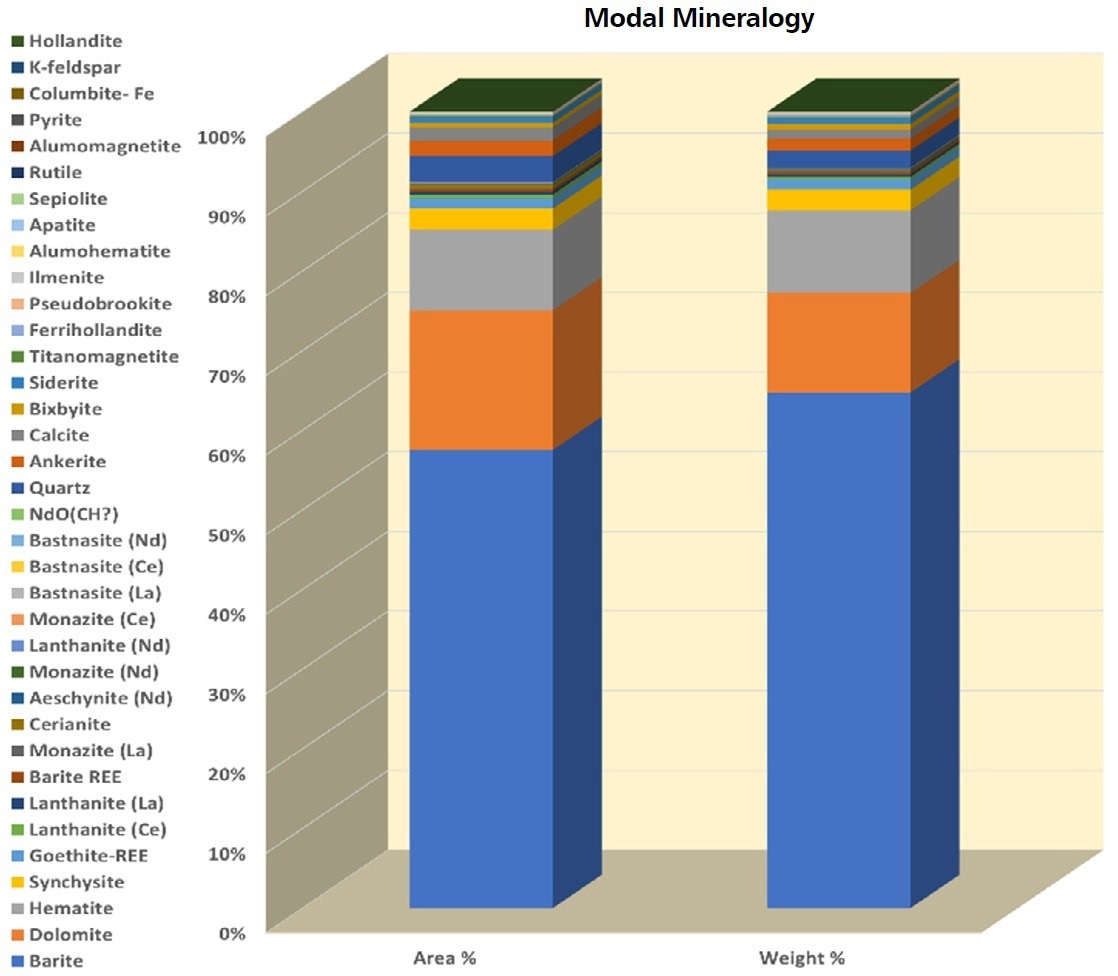
Figure 2. Modal composition in area% and wt% contribution of the distinct phases. The sample is dominated by barite, dolomite, and hematite. Synchysite is the major REE mineral present with lanthanide and bastnasite making a lower contribution. Image Credit: ZEISS Raw Materials Group
Synchysite dominates the rare earth element (REE) mineralogy (2.6wt% of the sample) with other contributions coming from lanthanite, monazite, aeschynite, cerianite, bastnasite, and NdO(CH). In addition to the REE minerals, goethite and a small percentage of the barite contain REE. These examples have been separately classified as barite-REE and goethite-REE.
Goethite-REE constitutes 1.3 wt% of the sample and is made up of Ce 9.25 wt%, La 3.09 wt%, Nd 2.14 wt%, Dy 5600 ppm, Eu 1100 ppm, Pr 200 ppm, and Er 200 ppm. Barite-REE represents 0.3 wt% of the sample and is made up of Ce 9.89 wt%, La 2.47 wt%, Nd 1 wt%, Eu 1100 ppm, Tm 600 ppm, Ho 500 ppm, Dy 300 ppm, Pr 200 ppm, Gd 200 ppm, Yb 100 ppm, and Lu 100 ppm.
Since ML runs a quantified chemical analysis of the sample, the assay reported in this article is the assay measured during the analysis. The grade for each element is displayed in the row for the sample assay and the phases’ datums are relative to the grade of the individual minerals (Table 2).
Table 2. Assay table. ZEISS Mineralogic performs a full quantified chemical analysis at each point analyzed which allows it to report a sample composition and assay of elements of interest without recurring to secondary instruments. Based on the analyses, only La 6100 ppm, Ce 1.3 wt%, and Nd 3200 ppm are present in notable concentrations. Source: ZEISS Raw Materials Group
| |
Wt % |
F |
La |
Ce |
Pr |
Nd |
Sm |
Eu |
Gd |
Tb |
Dy |
Ho |
Er |
Tm |
Yb |
Lu |
| Sample Assay |
|
9.8E-03 |
6.1E-01 |
1.3E+00 |
2.3E-03 |
3.2E-01 |
1.0E-04 |
3.4E-03 |
1.4E-04 |
5.5E-06 |
7.6E-03 |
1.3E-04 |
2.0E-04 |
1.6E-04 |
4.5E-03 |
7.2E-05 |
| Aeschynite (Nd) |
0.15 |
1.2E-03 |
1.7E-02 |
1.1E-02 |
1.1E-04 |
1.9E-02 |
3.7E-05 |
bd |
7.5E-06 |
bd |
bd |
bd |
bd |
bd |
1.9E-07 |
bd |
| Barite REE |
0.25 |
1.8E-05 |
6.0E-03 |
2.4E-02 |
4.5E-05 |
2.4E-03 |
1.2E-05 |
2.7E-04 |
4.0E-05 |
3.3E-06 |
7.4E-05 |
1.2E-04 |
3.3E-06 |
1.5E-04 |
2.9E-05 |
1.5E-05 |
| Bastnasite (Ce) |
0.01 |
1.3E-03 |
2.9E-03 |
4.5E-03 |
3.1E-06 |
1.1E-03 |
bd |
bd |
bd |
bd |
bd |
bd |
bd |
bd |
bd |
bd |
| Bastnasite (La) |
0.02 |
1.9E-03 |
6.4E-03 |
1.4E-03 |
1.4E-05 |
4.2E-03 |
2.9E-06 |
bd |
bd |
bd |
bd |
bd |
bd |
bd |
bd |
bd |
| Bastnasite (Nd) |
0.00 |
4.6E-04 |
1.1E-03 |
9.5E-05 |
2.3E-05 |
1.4E-03 |
bd |
bd |
bd |
bd |
bd |
bd |
bd |
bd |
bd |
bd |
| Cerianite |
0.13 |
2.5E-06 |
6.5E-06 |
7.9E-02 |
7.0E-06 |
bd |
bd |
1.5E-06 |
4.4E-06 |
bd |
2.7E-06 |
bd |
bd |
6.7E-07 |
bd |
bd |
| Goethite-REE |
2.88 |
3.3E-04 |
3.6E-02 |
1.1E-01 |
2.5E-04 |
2.5E-02 |
1.4E-05 |
1.3E-03 |
1.8E-06 |
bd |
6.6E-03 |
bd |
1.9E-04 |
2.7E-06 |
2.0E-05 |
1.1E-05 |
| Lanthanite (Ce) |
0.29 |
3.4E-05 |
8.3E-02 |
1.5E-01 |
2.9E-04 |
3.3E-02 |
2.4E-06 |
5.0E-06 |
7.4E-06 |
1.5E-06 |
bd |
bd |
bd |
bd |
bd |
1.8E-06 |
| Lanthanite (La) |
0.21 |
3.6E-05 |
9.2E-02 |
4.0E-02 |
3.3E-04 |
5.5E-02 |
1.8E-06 |
bd |
bd |
bd |
bd |
bd |
bd |
bd |
3.0E-06 |
bd |
| Lanthanite (Nd) |
0.04 |
bd |
1.5E-02 |
2.6E-03 |
2.7E-04 |
1.7E-02 |
3.5E-06 |
bd |
bd |
bd |
bd |
bd |
bd |
bd |
bd |
bd |
| Monazite (Ce) |
0.04 |
bd |
9.6E-04 |
9.7E-03 |
bd |
9.0E-04 |
bd |
bd |
bd |
bd |
bd |
bd |
bd |
bd |
bd |
bd |
| Monazite (La) |
0.19 |
bd |
2.8E-02 |
7.7E-04 |
3.9E-05 |
1.6E-02 |
bd |
bd |
bd |
bd |
3.7E-06 |
bd |
bd |
bd |
bd |
bd |
| Monazite (Nd) |
0.09 |
bd |
8.9E-03 |
6.8E-04 |
2.2E-04 |
1.3E-02 |
bd |
bd |
bd |
bd |
3.5E-06 |
bd |
bd |
bd |
bd |
bd |
| NdO(CH?) |
0.004 |
bd |
9.7E-04 |
5.3E-05 |
bd |
2.2E-03 |
bd |
bd |
bd |
bd |
bd |
bd |
bd |
bd |
bd |
bd |
| Synchysite |
2.58 |
3.9E-03 |
3.1E-01 |
8.0E-01 |
6.9E-04 |
1.3E-01 |
2.1E-05 |
1.2E-05 |
6.0E-05 |
bd |
1.3E-05 |
bd |
bd |
bd |
bd |
bd |
Element concentrations are displayed as wt% contribution to the sample and are determined by the calculation of each individual analyzed spot. Therefore, at the sample level, if not at the individual spot level, it is possible to identify concentrations at ppb.
The sample is dominated by the light REE with La, Ce, and Nd, which accounts for the bulk of REE presence. The critical phases are synchysite, lanthanite, and goethite-REE (Figure 3), which deliver >80% of the total La, Ce, and Nd (Table 3) between them.
Table 3. Element distribution table. Synchisite contains the majority of La, Ce, and Nd with other phases of interest being lanthanite minerals and goethite-REE. Source: ZEISS Raw Materials Group
| |
F |
La |
Ce |
Pr |
Nd |
Sm |
Eu |
Gd |
Tb |
Dy |
Ho |
Er |
Tm |
Yb |
Lu |
| Aeschynite (Nd) |
11.8 |
2.7 |
0.9 |
4.9 |
5.9 |
35.1 |
0.0 |
5.2 |
0.0 |
0.0 |
0.0 |
0.0 |
0.0 |
0.0 |
0.0 |
| Barite REE |
0.2 |
1.0 |
1.9 |
1.9 |
0.8 |
11.5 |
8.0 |
28.1 |
60.5 |
1.0 |
97.0 |
1.7 |
96.3 |
0.6 |
20.8 |
| Bastnasite (Ce) |
13.4 |
0.5 |
0.4 |
0.1 |
0.3 |
0.0 |
0.0 |
0.0 |
0.0 |
0.0 |
0.0 |
0.0 |
0.0 |
0.0 |
0.0 |
| Bastnasite (La) |
19.6 |
1.1 |
0.1 |
0.6 |
1.3 |
2.8 |
0.0 |
0.0 |
0.0 |
0.0 |
0.0 |
0.0 |
0.0 |
0.0 |
0.0 |
| Bastnasite (Nd) |
4.7 |
0.2 |
0.0 |
1.0 |
0.4 |
0.0 |
0.0 |
0.0 |
0.0 |
0.0 |
0.0 |
0.0 |
0.0 |
0.0 |
0.0 |
| Cerianite |
0.0 |
0.0 |
6.3 |
0.3 |
0.0 |
0.0 |
0.0 |
3.1 |
0.0 |
0.0 |
0.0 |
0.0 |
0.4 |
0.0 |
0.0 |
| Goethite-REE |
3.4 |
6.0 |
8.7 |
10.7 |
7.8 |
13.6 |
39.2 |
1.2 |
0.0 |
87.2 |
0.0 |
95.5 |
1.7 |
0.4 |
15.3 |
| Lanthanite (Ce) |
0.3 |
13.5 |
11.9 |
12.6 |
10.4 |
2.3 |
0.1 |
5.1 |
28.2 |
0.0 |
0.0 |
0.0 |
0.0 |
0.0 |
2.5 |
| Lanthanite (La) |
0.4 |
15.0 |
3.1 |
14.2 |
17.0 |
1.7 |
0.0 |
0.0 |
0.0 |
0.0 |
0.0 |
0.0 |
0.0 |
0.1 |
0.0 |
| Lanthanite (Nd) |
0.0 |
2.4 |
0.2 |
11.6 |
5.4 |
3.4 |
0.0 |
0.0 |
0.0 |
0.0 |
0.0 |
0.0 |
0.0 |
0.0 |
0.0 |
| Monazite (Ce) |
0.0 |
0.2 |
0.8 |
0.0 |
0.3 |
0.0 |
0.0 |
0.0 |
0.0 |
0.0 |
0.0 |
0.0 |
0.0 |
0.0 |
0.0 |
| Monazite (La) |
0.0 |
4.5 |
0.1 |
1.7 |
4.9 |
0.0 |
0.0 |
0.0 |
0.0 |
0.0 |
0.0 |
0.0 |
0.0 |
0.0 |
0.0 |
| Monazite (Nd) |
0.0 |
1.5 |
0.1 |
9.6 |
4.1 |
0.0 |
0.0 |
0.0 |
0.0 |
0.0 |
0.0 |
0.0 |
0.0 |
0.0 |
0.0 |
| NdO(CH?) |
0.0 |
0.2 |
0.0 |
0.0 |
0.7 |
0.0 |
0.0 |
0.0 |
0.0 |
0.0 |
0.0 |
0.0 |
0.0 |
0.0 |
0.0 |
| Synchysite |
39.8 |
51.1 |
63.6 |
29.7 |
40.3 |
19.9 |
0.3 |
42.0 |
0.0 |
0.2 |
0.0 |
0.0 |
0.0 |
0.0 |
0.0 |
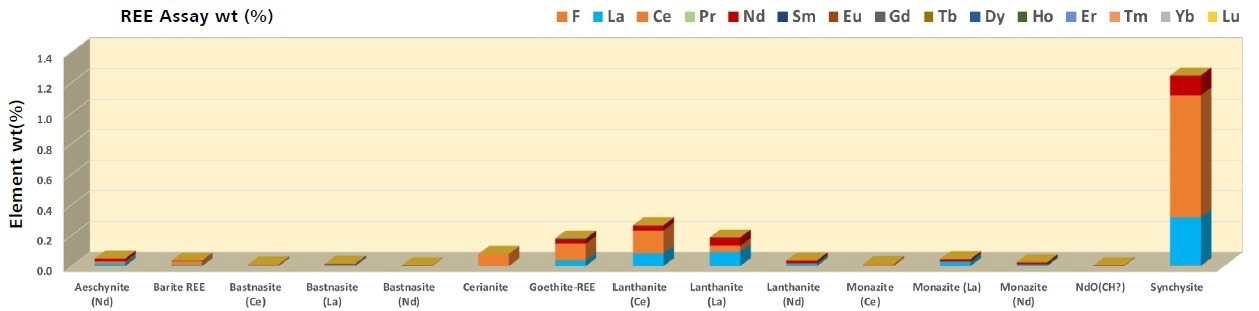
Figure 3. Synchisite, lanthanite, goethite-REE and ceiranite are the major contributors of La (6100 ppm), Ce (1.3wt%), and Nd (3200 ppm) to the sample. ZEISS Mineralogic provides a sample assay as part of the standard analysis which may be used for comparison to a more detailed chemical assay. The ability to report an assay contribution per phase provides a high degree of detail that may have been missed if the contribution of the phases to the bulk mineralogy alone were considered. Image Credit: ZEISS Raw Materials Group
Beneficiation
As an initial approach, it may be worth considering the application of beneficiation steps involving a high gradient magnetic separator (HGMS) to extract the Fe-oxides and the ferriferous dolomite from the mix, followed by flotation, to concentrate the synchisite.
It has been determined that HGMS and flotation are effective for the separation of ferriferous dolomite and in the concentration of carbonates respectively.3,4,5 However, for a workflow that incorporates a stage of pre-concentration by flotation, the sample remains a challenge. From the perspective of automated mineralogy, the chance of floating the value components of an ore is typically evaluated by conducting a liberation by area study.
In this measurement, it was determined that ≥80 area% of the particle must be a phase of interest for it to be considered liberated and meet the liberation criteria, while between <80 and ≥30 area% indicates the median, and <30 area% categorizes it as a locked phase that will not be concentrated by a flotation step.
According to these criteria, only 40% of the synchysite and 4% of the goethite-REE are liberated, and 26% and 50% are locked respectively (Table 4). Concentrating all particles with a synchisite exposure >50% by area, will produce < 60% synchisite (Figure 4).
Table 4. Area based liberation. Beneficiation of the ore by a flotation step is predicted to yield 40% of the synchisite, none of the lanthanites, and 4% of the goethite-REE. Source: ZEISS Raw Materials Group
| |
< 10% |
< 20% |
< 30% |
< 40% |
< 50% |
< 60% |
< 70% |
< 80% |
< 90% |
< 100% |
100 |
Liberated |
Middling |
Locked |
| Aeschynite (Nd) |
82 |
17 |
1 |
0 |
0 |
0 |
0 |
0 |
0 |
0 |
0 |
0 |
0 |
100 |
| Barite REE |
100 |
0 |
0 |
0 |
0 |
0 |
0 |
0 |
0 |
0 |
0 |
0 |
0 |
100 |
| Bastnasite (Ce) |
82 |
18 |
0 |
0 |
0 |
0 |
0 |
0 |
0 |
0 |
0 |
0 |
0 |
100 |
| Bastnasite (La) |
95 |
5 |
0 |
0 |
0 |
0 |
0 |
0 |
0 |
0 |
0 |
0 |
0 |
100 |
| Bastnasite (Nd) |
90 |
10 |
0 |
0 |
0 |
0 |
0 |
0 |
0 |
0 |
0 |
0 |
0 |
100 |
| Cerianite |
51 |
15 |
12 |
5 |
5 |
7 |
1 |
3 |
0 |
0 |
0 |
1 |
21 |
78 |
| Goethite-REE |
45 |
19 |
13 |
3 |
3 |
3 |
5 |
6 |
3 |
0 |
0 |
4 |
19 |
77 |
| Lanthanite (Ce) |
41 |
24 |
14 |
9 |
6 |
3 |
1 |
2 |
0 |
0 |
0 |
0 |
21 |
79 |
| Lanthanite (La) |
42 |
24 |
16 |
12 |
5 |
1 |
0 |
0 |
0 |
0 |
0 |
0 |
18 |
82 |
| Lanthanite (Nd) |
85 |
6 |
2 |
6 |
1 |
0 |
0 |
0 |
0 |
0 |
0 |
0 |
7 |
93 |
| Monazite (Ce) |
72 |
17 |
0 |
0 |
8 |
0 |
3 |
0 |
0 |
0 |
0 |
0 |
11 |
89 |
| Monazite (La) |
18 |
23 |
48 |
2 |
8 |
2 |
0 |
0 |
0 |
0 |
0 |
0 |
12 |
88 |
| Monazite (Nd) |
50 |
32 |
4 |
3 |
0 |
0 |
11 |
0 |
0 |
0 |
0 |
0 |
14 |
86 |
| NdO(CH?) |
99 |
1 |
0 |
0 |
0 |
0 |
0 |
0 |
0 |
0 |
0 |
0 |
0 |
100 |
| Synchysite |
11 |
8 |
7 |
9 |
7 |
5 |
6 |
6 |
24 |
16 |
0 |
40 |
33 |
26 |
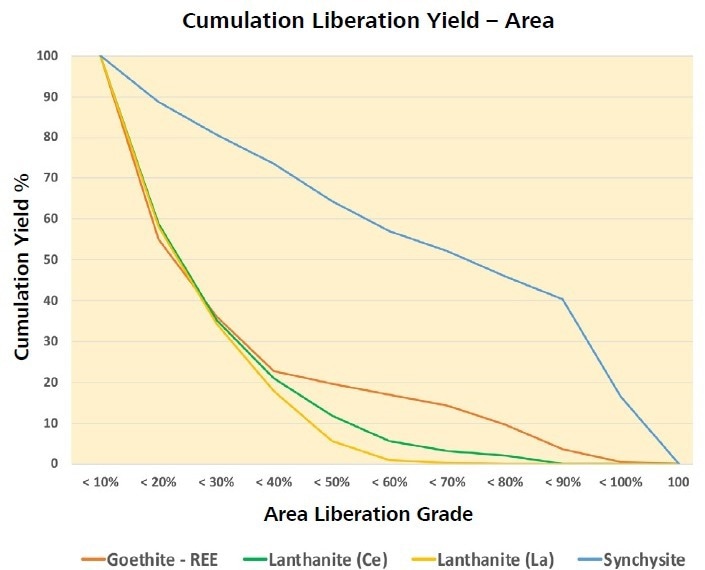
Figure 4. Cumulative liberation yield curve. A beneficiation step involving flotation of particles composed of ≥80 area% synchisite can be expected to yield a 40% concentrate. Image Credit: ZEISS Raw Materials Group
There is the risk of diluting the synchisite yield further if a beneficiation step involving HGMS is introduced to remove the hematite and ferriferous carbonates, since it has associations with siderite, hematite, and dolomite (Figure 5).
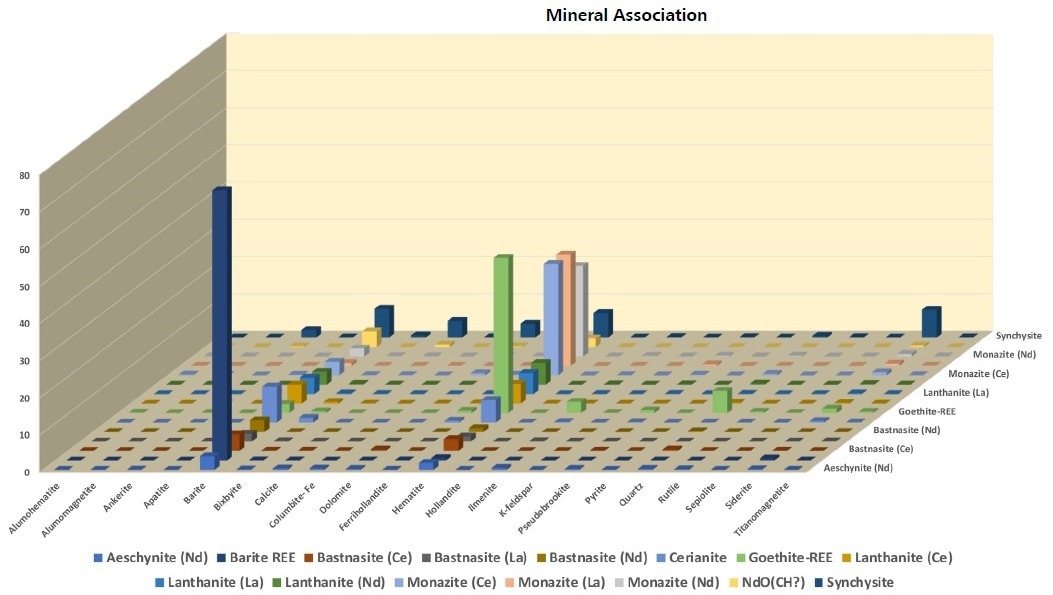
Figure 5. Contact associations of the REE-phases with gangue. All phases of interest are associated with barite and hematite. Synchisite has notable associations with siderite, hematite, dolomite, calcite, barite and ankerite. Image Credit: ZEISS Raw Materials Group
Particle Matters
The mineral information and association data show an image of complexity that cannot be resolved at the mineral level but necessitates information relative to the particles that make up the sample itself. Through its lithological classification function, ML offers particle measurement and classification predicated on parameters determined by the operator.
In this example, it has been determined that the particle classifications match liberation grades with the group of REE minerals making up the parameter of interest. For instance, the criteria for particle classification >80 REE is that ≥80% of the area of the particle must comprise REE minerals. Therefore, it can be instantly recognized that over 50% of the sample incorporates particles that contain <10% by area REE minerals (Table 5 and Figure 6).
Table 5. Bulk particle data segmented into groups depending on their REE mineral content judged by their surface area contribution to the particle. For example, REE >80 refers to particles that are composed of 80% or more REE minerals. REE <10 refers to particles that are composed of less than 10 area% REE Minerals and more or equal to 0.1 area%. Remaining particles may contain REE minerals up to below 0.1% by area. Source: ZEISS Raw Materials Group
| |
Number |
Area % |
Weight % |
Particle Size (μm) |
Particle Density (g/cm³) |
| REE >80 |
482 |
2.1 |
1.8 |
86.3 |
3.1 |
| REE <80 |
209 |
0.6 |
0.5 |
70.6 |
3.1 |
| REE <70 |
132 |
0.5 |
0.5 |
77.1 |
3.1 |
| REE <60 |
109 |
0.6 |
0.5 |
93.0 |
3.3 |
| REE <50 |
117 |
0.9 |
0.9 |
108.5 |
3.3 |
| REE <40 |
112 |
1.2 |
1.1 |
129.0 |
3.4 |
| REE <30 |
181 |
2.0 |
2.0 |
131.9 |
3.6 |
| REE <20 |
396 |
4.1 |
4.1 |
126.6 |
3.7 |
| REE <10 |
4517 |
53.9 |
56.7 |
151.3 |
4.1 |
Remaining
Particles |
7743 |
34.1 |
31.9 |
87.7 |
3.8 |
Table 6. Bulk particle data with further segmentations for particles containing between 10 area% and 0.1 area% REE phases. The high proportion of REE <10 makes this particle class significant to the process. The particle size in the analyzed sample is below that which would be considered for density separation methods but the increase in particle density with increasing gangue component adds hope in this respect. Source: ZEISS Raw Materials Group
| |
Number |
Area % |
Weight % |
Particle Size (μm) |
Particle Density (g/cm³) |
| REE >80 |
482 |
2.1 |
1.8 |
86.3 |
3.1 |
| REE <80 |
209 |
0.6 |
0.5 |
70.6 |
3.1 |
| REE <70 |
132 |
0.5 |
0.5 |
77.1 |
3.1 |
| REE <60 |
109 |
0.6 |
0.5 |
93.0 |
3.3 |
| REE <50 |
117 |
0.9 |
0.9 |
108.5 |
3.3 |
| REE <40 |
112 |
1.2 |
1.1 |
129.0 |
3.4 |
| REE <30 |
181 |
2.0 |
2.0 |
131.9 |
3.6 |
| REE <20 |
396 |
4.1 |
4.1 |
126.6 |
3.7 |
| REE <10 |
4646 |
23.1 |
23.2 |
123.6 |
3.9 |
| REE >09 |
127 |
1.3 |
1.3 |
141.6 |
4.2 |
| REE <08 |
158 |
1.6 |
1.7 |
145.7 |
4.1 |
| REE <07 |
186 |
2.2 |
2.3 |
157.9 |
4.2 |
| REE <06 |
209 |
2.5 |
2.6 |
159.9 |
4.2 |
| REE <05 |
242 |
3.6 |
3.8 |
180.5 |
4.2 |
| REE <04 |
288 |
4.6 |
5.0 |
192.8 |
4.3 |
| REE <03 |
365 |
6.9 |
7.8 |
211.8 |
4.3 |
| REE <02 |
296 |
8.1 |
8.9 |
256.5 |
4.2 |
Remaining
Particles |
7743 |
34.1 |
31.9 |
87.7 |
3.8 |
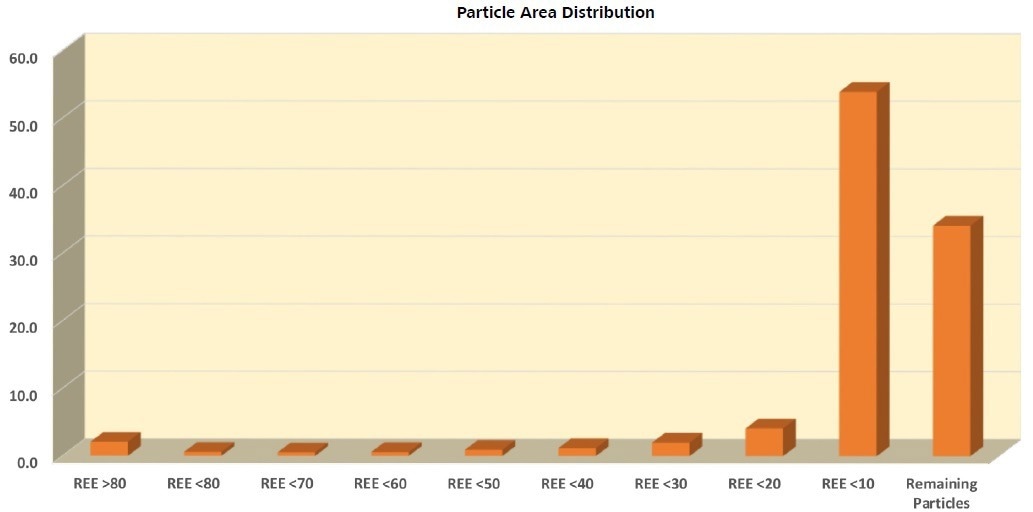
Figure 6. Sample description considering the REE grade of the particles. The largest area contribution to the sample is from particles composed of between <10 and ≥0.1 area% REE mineral, and particles containing <0.1 area% REE mineral (Remaining Particles). Image Credit: ZEISS Raw Materials Group
Since such a significant portion of the sample resides in the <10% REE particle fraction, additional characterization of the data is preferred. The retrospective analysis function of ML is employed to acquire new descriptions and particle measurements without having to resort to SEM.
Additional analysis reveals that the largest particle groups are REE <10 (23 wt%) and particles which are comprised of <0.1 area% REE, designated as Remaining Particles (32 wt%) in Table
There is a distinct increase in hematite and barite, with decreasing REE phase content with pyrite gradually progressively more relevant, particularly in the Remaining Particles group (Figure 7). Particle size increases in conjunction with decreasing REE-phase content with a significant drop in the size of particles containing <0.1% REE. This effect may be indicative of the increased proportion of barite with decreasing REE-phase until pyrite becomes relevant in the Remaining Particles group.
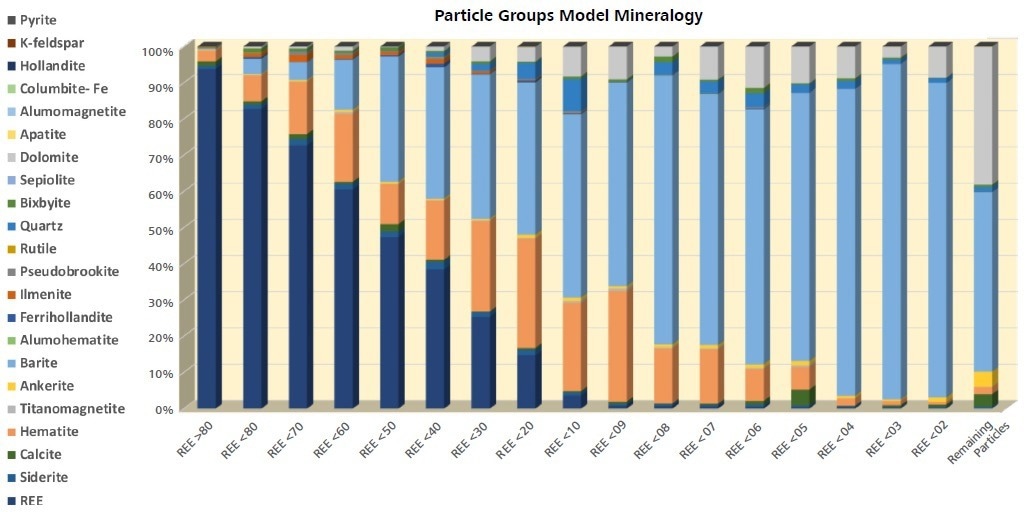
Figure 7. Modal mineralogy of each particle class containing REE phases. As REE minerals decrease, Fe-oxides, carbonates, and pyrite become dominant phases. Image Credit: ZEISS Raw Materials Group
Pyrite, with an average size of 17 µm, c.f. barite at 86 µm, may attempt to increase the friability of these particles. As pyrite and barite become more prevalent in the particles’ groups modal mineralogies, the density of the particles increases with decreased REE content (Figures 8 and 9, and Table 6).
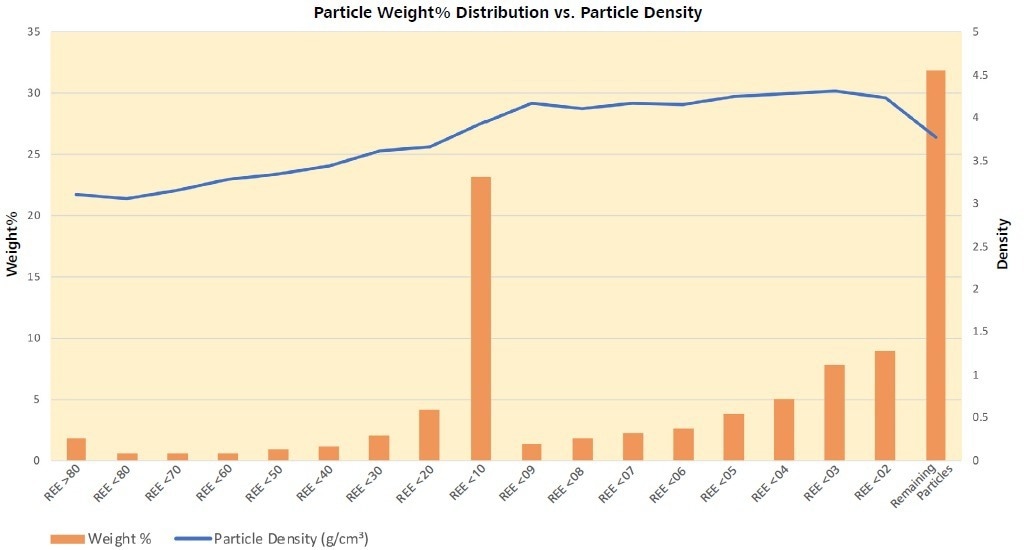
Figure 8. Weight percent distribution of the sample among the particle classes. Particles containing <0.1% REE-phase make up >30% of the sample, although, they are not the densest particles present. Generally, density increases with decreasing REE-phase presence. Image Credit: ZEISS Raw Materials Group
Density increases with decreasing REE content (Figure 8) which represents that the particles containing the greatest proportion of REE minerals are the lightest. There is a relative increase in particle size with increasing density and decreasing REE content (Figure 9) which correlates with the increasing barite (Ba), Fe-oxide (Fe) and pyrite (S) content and decreasing carbonates (Figures 7 and 10).
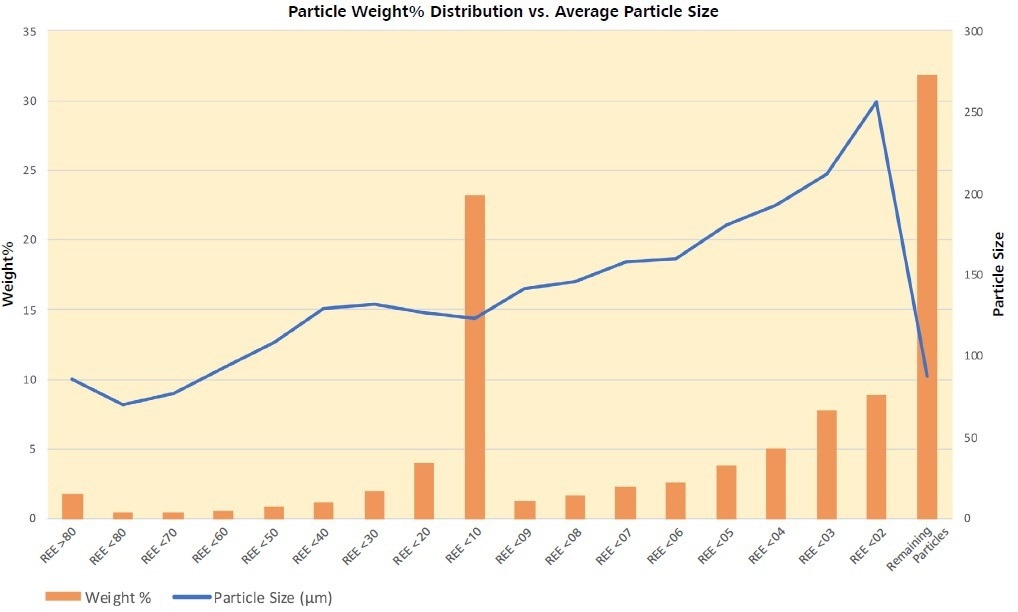
Figure 9. Particle size increases with decreasing REE-phase content with a marked drop in the size of particles containing <0.1% REE. This effect may reflect the increased proportion of barite with decreasing REE-phase until pyrite becomes significant in the Remaining Particles. Pyrite with an average size of 17 μm, c.f. barite at 86 μm, may be acting to increase the friability of these particles. Image Credit: ZEISS Raw Materials Group
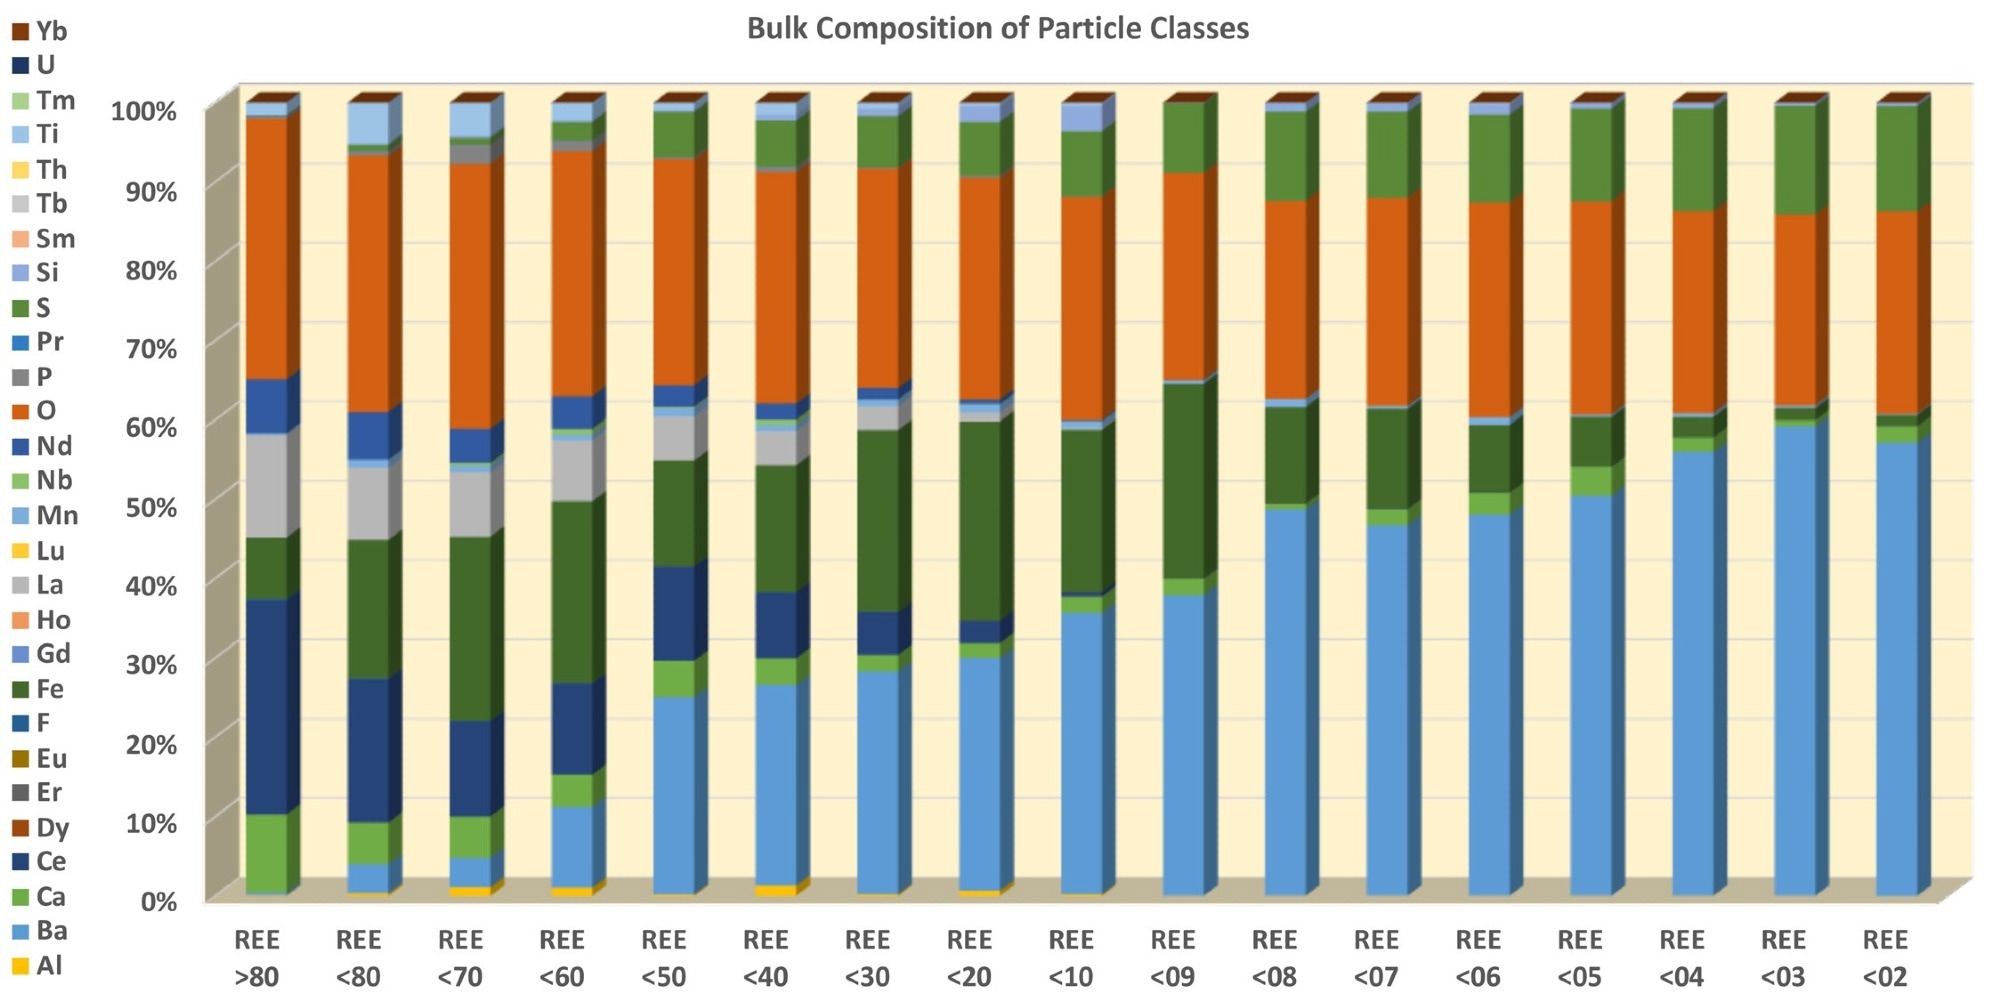
Figure 10. Decreasing REE is matched by increased Ba, Fe, and S concentration. Image Credit: ZEISS Raw Materials Group
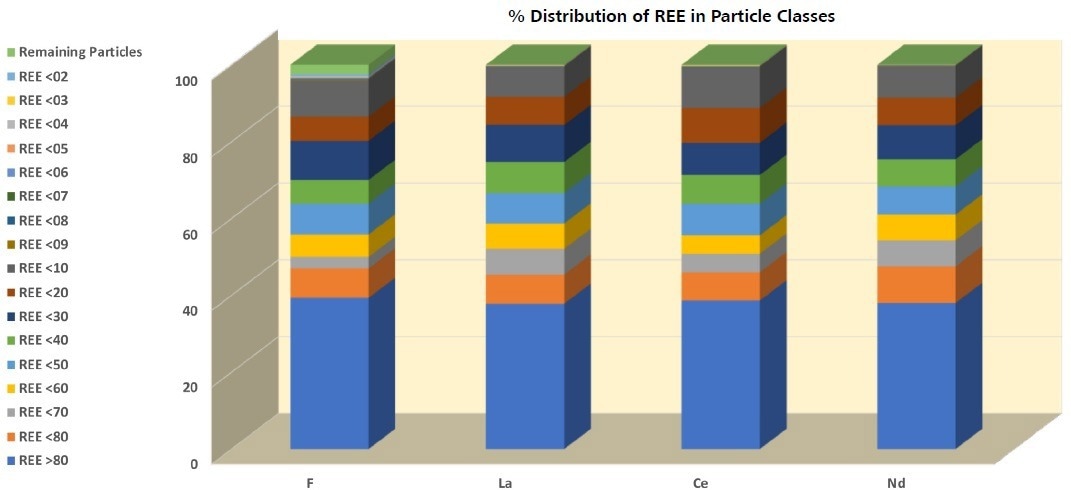
Figure 11. There is a clear three-step change between the distribution of F, La, Ce, and Nd among the particle classes. The highest concentration can be found in REE >80 that accounts for >30% of each. This is followed by a relatively even distribution between REE <80 and REE <10, and finally a step down to a much lower concentration for the fractions below REE <09. Image Credit: ZEISS Raw Materials Group
The distribution of F, La, Ce, and Nd among the particle classes (Figure 10) offers insight into the total sample composition. A three-step distribution is apparent in an instant, with REE >80 being the richest sub-sample by far. This is followed by a comparatively homogeneous distribution between REE <80 and REE <10.
Ultimately, each of the subgroups below and including REE <09 are comprised of a negligible concentration of the elements. Particles from REE >80 and REE <10 are comprised of more than 80 wt% of F, La, Ce, and Nd.
Associating particle composition with particle size implies that a size filtration, as an initial approach, could eliminate >30 percent of the unwanted mass, boosting the remainder. However, particle size and density differences are not sufficient for separating the Remaining Particles group, which constitutes 31.9 wt% of the original sample or ~48 wt% of the upgraded product.
At this stage, to further enrich the product, a froth flotation step that suppresses dolomite and ankerite flotation would be useful when left with Remaining Particles and particles with equal or higher REE concentration to REE <10.
Summary
When it comes to deciding which is the best processing route for any ore, an extended research period must be conducted that involves the application of several analytical techniques and experimentation. Traditional automated mineralogy techniques can help harvest data for this decision-making process but are limited to mineral classification, associations, and liberation outputs.
ZEISS Mineralogic exceeds the application potential of other techniques as it offers a significant advantage bolstered by the fact it provides chemical information and particle descriptions pertinent to beneficiation.
The particle characterization affords the opportunity to obtain insights previously unavailable, relative to the ore’s performance under different approaches. While it may not offer any final answers on its own, it offers excellent guidance on what tests should be conducted in the laboratory.
References
- D.E.Newbury and N.W.M.Ritchie. J Mater Sci (2015) 50:493–518 DOI 10.1007/s10853-014-8685-2
- R.Taylor, E.Hill, R.Khan, T.Johnson, C.Clark, and P.Lanari Goldschmidt Abstracts (2020), 2020 2574
- P.Blazy and E.A.Jdid International Journal of Mineral Processing 49, 1-2 (1997), 49-58
- Yang X et al., Minerals Engineering 71 (2015), 55-64
- H.Soto and L.Iwasaki Int. J. Miner. Process 16 (1986), 17-27

This information has been sourced, reviewed and adapted from materials provided by Carl Zeiss Microscopy GmbH.
For more information on this source, please visit Carl Zeiss Microscopy GmbH.