A mineral processing circuit’s core aim is to concentrate more valuable minerals by exploiting the differences in their chemical and/or physical properties. Minerals are very rarely totally liberated, and these often occur as composite particles whose bulk physical properties are largely determined by the materials that they are made up of.
To quantitatively assess a target mineral’s distribution with respect to the utilization of a particular physical property, the bulk value of each individual particle must be calculated. This process can be hugely assisted by automated mineralogy systems; as these systems are able to analyze considerable amounts of mineral grains in relatively short periods of time, generating particle-specific data which can then be interpreted by the minerals processing engineer.
Within the application discussed here, the response of tungsten ore has been assessed for two of the more typically used physical separation methods – magnetic and gravity.
The Problem: Particles vs. Minerals
Responses to any given target phase to physical separation methods will deviate from the ideal case, unless the feed material being processed is wholly made up of fully liberated mineral grains. Being able to understand the characteristics and extent of this deviation can make decision-making easier, especially in terms of the optimization of the recovery-grade relationship.
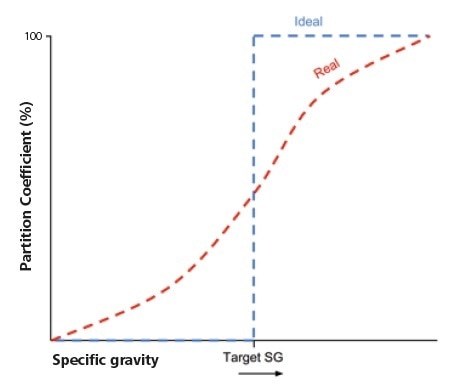
Figure 1. Schematic representation of partition curves of a fully-liberated target phase (ideal) and within a typical feed, in which targets are locked with other phases of differing SG (real).
In fact, it is nearly impossible to obtain the required volume of data to accurately represent the magnetic/gravity profile of a particulate feed without the use of automated mineralogy.
Being able to identify large amounts of individual particles and mapping their constituent mineral phases at high spatial resolution allows the bulk specific gravity (SG) and magnetic susceptibility (MS) of each particle to be calculated. Acquisition of enough of this data can ultimately allow the creation of specific, predictive recovery curves for magnetic separation and gravity.
Materials and Analytical Method
Within this example, a sample of pre-concentrated tungsten ore (500-53 μm) was first examined optically. This was done using reflected and transmitted light microscopy, using this approach to characterize the mineral phases present in the sample.
The target materials in this case were wolframite, ferberite, and cassiterite (a by-product). These were accompanied by a granitic gangue assemblage that was dominated by tourmaline, quartz, mica and clay minerals, alongside numerous iron, and titanium oxide phases.
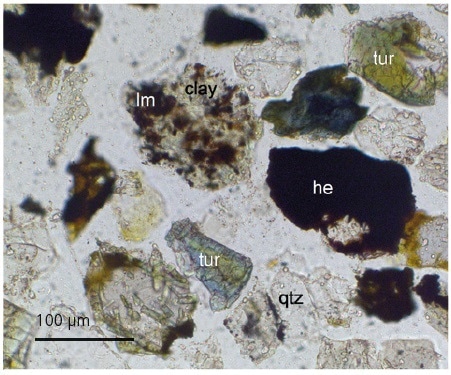
Figure 2. Transmitted light image showing fine haematite (he) & limonite (lm) locked with quartz (qtz), tourmaline (tur) and clay.
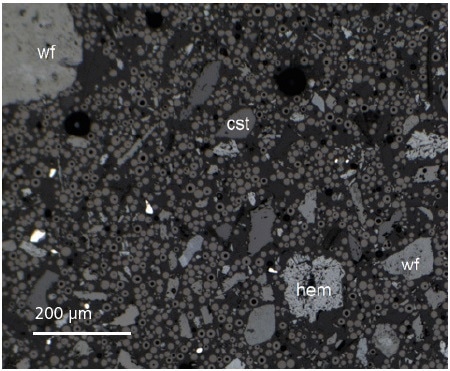
Figure 3. Particle separation, essential for acquiring accurate particle-specific data, is achieved by mixing the sample with spherical glassy carbon during sample preparation.
Ferberite and wolframite are often very closely linked, on a less than 10 μm scale, with clays and iron oxides. As a result of this, the bulk SG and MS values of many target-bearing particles can be affected. All the subsamples used here were dry-mixed with spherical carbon to make sure that particles were separated. They were then prepared as 30 mm diameter polished blocks before being carbon coated to a thickness of 10 mm.
A ZEISS EVO scanning electron microscope (SEM) was used for quantitative mineralogical analysis. This was equipped with a 60 mm2 Bruker 6 | 60 xFlash® energy dispersive X-ray spectra (EDS) detector at Petrolab Ltd, Redruth, UK.
Throughout the process, an Agar LaB6 filament, measured probe current of 1.5 nA, accelerating voltage of 20 kV and working distance of 9.5 mm was utilized. This was used alongside EDS detectors calibrated to a Cu standard (Kα peak) at 90-minute intervals or between each sample.
The samples themselves were mapped using quantitate chemical analysis with Φ-ρ-Z correction. This was done on a μm grid for a minimum of two hours per sample, resulting in approximately 1,000 - 4,000 particles being analyzed on each.
The ZEISS Mineralogic Mining™ automated mineralogy platform makes use of backscattered electron (BSE) thresholding to differentiate particles from the resin background and spherical carbon, before then mapping each particle at the required resolution.
Table 1. List of key phases and compositional criteria used for classification; all compositions also contain oxygen.SG and MS are specific gravity and magnetic susceptibility, respectively.
| Mineral |
SG |
MS |
Chemistry (wt% per element) |
| Wolframite |
7.3 |
0.22 |
Fe: 1-25, W: 50-80, Mn: 1-25, O: >0 |
| Ferberite |
7.45 |
0.25 |
Fe: 5-25, W: 50-80, Mn: <1, O: >0 |
| Cassiterite |
6.9 |
0.06 |
Sn: >50, O: >0 |
| Ilmenite |
4.72 |
0.40 |
Ti: 20-55, Fe: 10-45, Mn: 0-5, O: 10-60 |
| Haematite |
5.3 |
0.50 |
Fe: 60-70, O: >0 |
| FeOx |
4.72 |
0.50 |
Fe: 20-90, Mg <20, Ti: <20, 0: >0 |
| Magnetite |
5.15 |
10.0 |
Fe: 70-80, O: 20-50 |
| Tourmaline |
3.15 |
0.20 |
Si: 10-25, Al: 10-30, Fe: 2-25, Na: < 5, Mg: < 7, Ca: < 5 |
| Quartz |
2.65 |
0.06 |
Si: 30-70, O: 30-70 |
At each point of the analysis, a mineral phase was assigned based on a combination of EDS measurements and a classification scheme which was developed through initial optical study and the collect of X-ray spectra from known occurrences during the set-up process.
The database of outputs was made up of all the identified particles, alongside a variety of morphological data and their component mineral grains.
Data Presentation and Interpretation
Cumulative recovery curves of key phrases were built using the mapped particle data collected during previous phases. These were constructed across the range of particle MS and SG values available, alongside the sample’s distribution by mass.
This combination of sample mass distribution and target mineral profiles can show separation opportunities. It is during these separation opportunities when concentration, recovery and grade factors are optimized.
Specific Gravity
As can be seen here, less than 50% of the sample’s mass is made up of particles that have a bulk SG of less than 3.0. Examining target minerals that have gangue phases can be considered to lower the bulk SG of target-bearing particles. This affects the gravity profiles of the target populations.
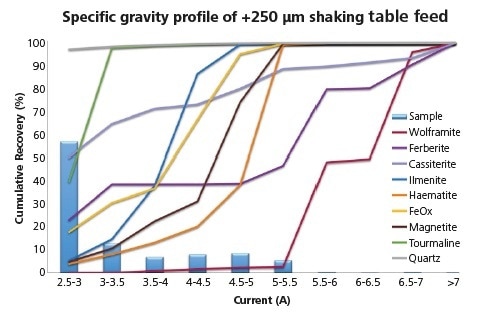
Figure 4. Specific gravity profile of target phases showing key gangue and overall particle specific gravity distribution within the > 250 μm feed sample.
Consider the example here, where the association of ferberite and cassiterite with low-SG gangue (quartz and clays) has led to c. 20% and 50% falling into the lowest SG class respectively.
The sudden increase in both ferberite and wolframite in particles of SG of 5.0 - 6.0 highlights the common locking with Fe- and Ti- oxides.
After a shaking table had been used for gravity separation, individual products were then analyzed to assess the success of gravity concentration in respect of the calculated feed profile. Each product showed a shift in SG distribution, thus clearly showing the expected concentration of phases.
As can be seen here, the distribution of the concentrate is bimodal with peaks in SG classes 4.5 - 5.0 and 6.5 - 7.0, respectively
Iron (+/- titanium) oxides of intermediate SG and target phases of high SG can be clearly identified as the phases responsible in this instance. The steep profile of all the phases at close to their ideal SG highlights that minerals within the concentrate are, for the most part, well liberated and the target lock minerals shown in the feed profile have reported to middlings/tails. Additionally, obtaining quantitative chemical data has allowed for the tracking of elemental profiles by SG.
To provide a visible example, it can be seen here that iron is predominantly contained within the Fe/Ti oxides, with around 20% of this residing in high SG targets. Plotting the products can also be helpful in ascertaining the potential for further upgrading of concentrates.
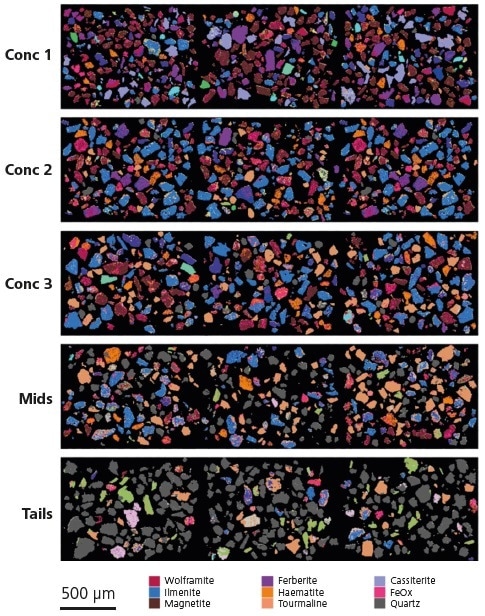
Figure 5. Selected fields of analyzed particles within each shaking table product, visually displaying changes in mineralogy. Note that, for clarity, only key mineral phases are displayed in the legend.
The profile shown here reveals that separation at a cleaner table splitting at an SG of around five would be able to produce a far higher-grade concentrate, rejecting over 50% of the material with a loss of target phases that is smaller than 10%.
Magnetic Susceptibility
Next, the table concentrates were analyzed to look at their magnetic susceptibility. This was achieved by assigning a value to each phase that was proportional to the optimum field strength needed to attract each mineral. These field strengths were taken from work done by Rosenblum and Brownfield (1999).
Using this method, it is possible to maintain the relative differences between phases without using absolute values. This is particularly important as there is currently no comprehensive listing of the magnetic susceptibilities of minerals.
The mineral constituents of the gravity concentrate exhibit the full range of magnetic susceptibility, from ferromagnetic magnetite to diamagnetic quartz and cassiterite.
Additionally, intermediate paramagnetic minerals such as wolframite, ferberite, ilmenite, haematite and tourmaline, all have different MS values but within a small range. This worsens the difficulties posed by locking on effective separation.
The recovery profile of magnetite is especially shallow, as can be seen below. This reflects its close association with other phases. Paramagnetic phases generally show sharp responses, highlighting either association with one another or liberation.
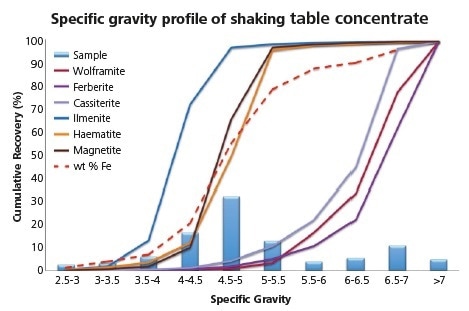
Figure 6. Specific gravity profile of key phases, particle mass distribution and total Fe recovery in shaking table concentrate.
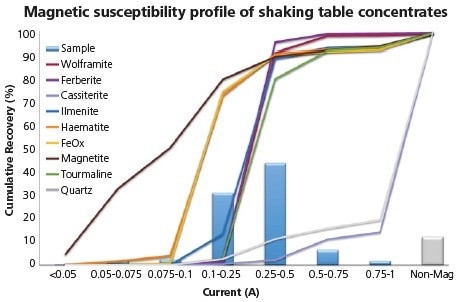
Figure 7. Magnetic susceptibility profile of combined concentrate fractions from shaking table tests.
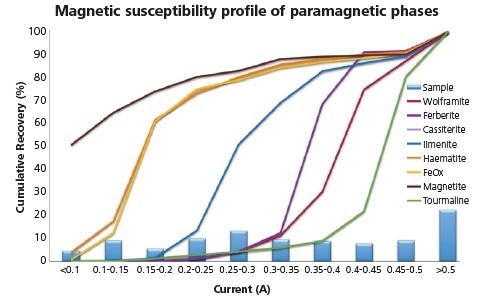
Figure 8. Magnetic susceptibility profile of combined shaking table concentrates replotted to resolve the differing responses of paramagnetic minerals.
There are of course, exceptions to this rule and in this case, these are haematite and FeOx. These responded at much lower intensity than was initially expected; this low response was due to a common association with magnetite. As can be seen here, only minor locking of cassiterite (at less than 15%) with magnetically susceptible phases results in a strong potential to produce a clean and non-magnetic tin concentrate.
To ascertain the most ideal point at which to separate paramagnetic targets from paramagnetic gangue, the phases in question could be replotted at a higher resolution. Here, Ilmenite, wolframite, ferberite and tourmaline appear to be similarly responsive as in earlier tests but show exploitable differences in their response in higher resolution imaging.
As these more detailed response profiles indicate, the separation of these minerals from gangue should be achievable. However, it is important to note that ilmenite and tourmaline (gangue) plot either side of the wolframite and ferberite (targets), suggesting that recovery of the targets is not achievable within one single separation.
Conclusions
As can be seen in the previous examples and figures, the particle and large grain datasets provided by Mineralogic Mining™allows users to not only characterize samples of particulate materials by their mineralogical and chemical properties, but also by the bulk physical properties of each particle, as calculated from constituent mineralogy.
Once collected, the mineral processor can use this dataset to plot magnetic susceptibility or gravity profiles for target phases, quickly creating a powerful tool for the identification of separation opportunities, as well as being able to predict potentially problematic overlaps during beneficiation.
Additionally, automated analysis of metallurgical test samples or ROM samples within a mineral processing plant can prove to be an incredibly useful tool for tracking and optimizing the separation of equipment, as highlighted by Grobler and Bosman (2011).
This data can be filtered further, and then compared with other parameters held within the output database. For example, detailed morphological and size measurements such as the shape factor data of target-bearing particles that are found to report to tails can be accessed and used to further explore the link between mineralogy, morphology and recovery.
Extensions to the application of this method could even include froth flotation with a range of other variables such as particle mass, liberation/free perimeter and morphological measurements being incorporated into the process.

This information has been sourced, reviewed and adapted from materials provided by Carl Zeiss Microscopy GmbH.
For more information on this source, please visit Carl Zeiss Microscopy GmbH.