This article shows how non-destructive, large representative volume, high-resolution analysis of samples can be employed to understand and characterize gold mineralization over representative volumes of drill core using X-ray microscopy (XRM).
Advantages Over 2D Analysis
All through the mining value chain, from exploration to process mineralogy, sample characterization generally focuses on obtaining quantitative information from samples, such as ore texture, bulk mineralogy, particle grain size, and ore association and distribution. Usually, these parameters are identified using a range of 2D analytical techniques, such as, automated mineralogy, electron microscopy, and light microscopy.
Although 2D analysis is vital in offering such valuable information, it comes with certain drawbacks. These methods involve laborious 2D preparation of samples, which is associated with a stereological and sampling bias. This situation is made more complex with precious metal-bearing samples, since the precious metals being considered are in “trace” amounts (<50 μm) with a sparse and heterogeneous distribution. Often defined as the “nugget” effect, it usually demands prohibitively large 2D areas to be analyzed to offer a statistically valid characterization of the mineralization.
This article presents a solution where X-ray microscopy techniques are applied to texturally characterize the distribution of gold mineralogy within drill core by using a multiscale “Scout and Zoom” workflow. Initially, the ZEISS Xradia 510 Versa uses its fast Flat Panel Extension (FPX) detector to macroscopically image the entire sample to detect precious metals. Versa then shifts to imaging using its high Resolution at a Distance (RaaD) optical detectors to create the high-resolution interior tomography images needed to characterize the mineralization.
Macroscopic Analysis – “Scout”
A single piece of drill core was chosen for XRM study with the objective of identifying areas where precious metal grains are present. This segment of drill core had a length of c. 6 cm and was analyzed using a ZEISS Xradia 510 Versa with FPX detector. The whole core, as shown in Figure 1, was scanned in about 11 hours using the FPX detector with a voxel resolution of 10 μm.
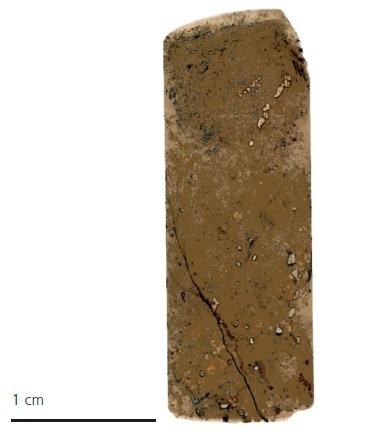
Figure 1. “Scout” view of the entire drill core (segmented to show the different mineral groups of silicates and sulfides).
The FPX detector can offer large field of view imaging with a high sample throughput, suitable for providing initial investigative “Scout” scans. These initial scans were used to give a macroscopic description of mineral distribution. They also located two regions of interest where highly attenuating phases are situated, which are assumed to be gold.
High Resolution Analysis – “Zoom”
Two regions were subsequently chosen for high-resolution imaging using interior tomography to find the textural and volumetric association of the gold. Generally μ-CT imaging exclusively depends on geometric magnification, needing considerable sample preparation to effectively achieve the required resolution of these fine-grained gold particles to make sure that the target region is as near as possible to the X-ray source.
Particularly, the ZEISS Xradia 510 Versa system integrates both optical and geometric magnification. At large source-sample working distances, regions of interest can be non-invasively imaged allowing the Resolution at a Distance (RaaD) capability that permits the imaging of regions within a large sample, without any preparation of samples (Figure 2).
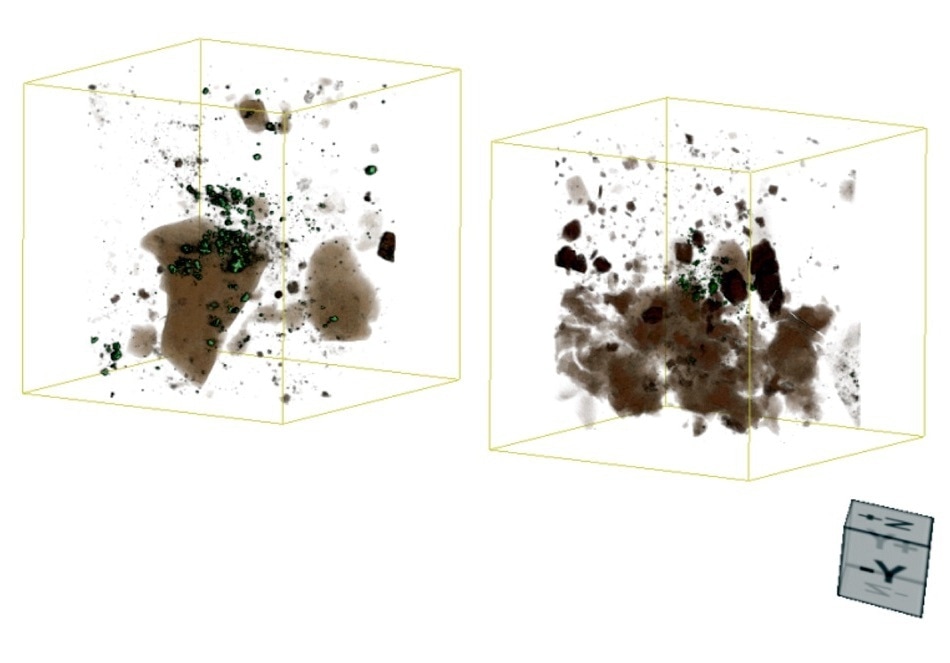
Figure 2. The two gold-bearing areas of interest imaged with a 4 μm voxel resolution and the 4x objective. These two scans were conducted with a 4 μm voxel size. They took approximately 7 and 6 hours to scan, respectively.
The two regions of interest demonstrate the distribution of gold in this part of the deposit as discrete clouds, comprising of multiple gold grains that are less than 25 microns, and hosted within the quartz vein. The analysis also demonstrates that the gold has a close spatial association with pyrite and the mineralized vein cross-cutting the sample.
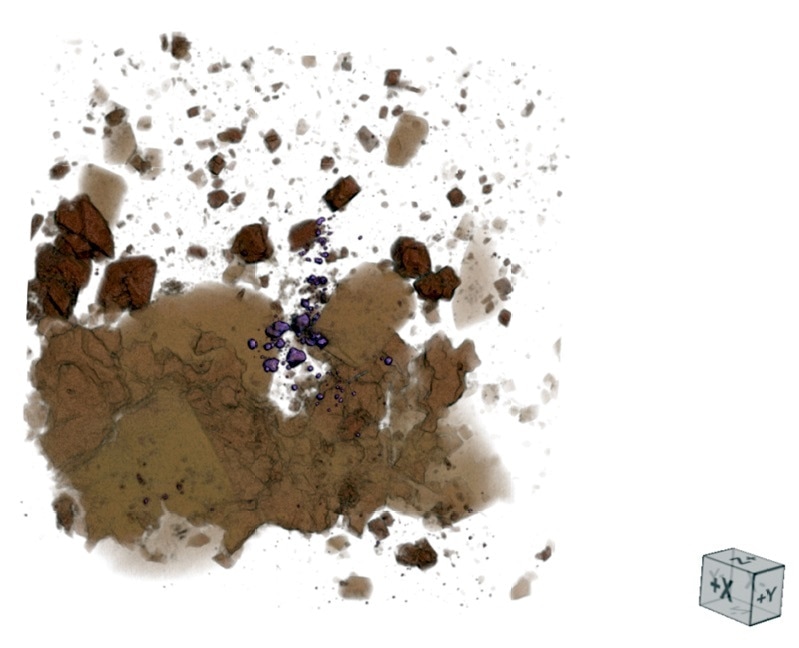
Figure 3. Detailed view of one of the gold bearing regions. The gold mineralization can be clearly seen as the purple colored particles.
The Importance of Representative Sampling
The heterogeneous distribution of gold mineralization within the core is evident from the low-resolution scans, presenting a major challenge during sampling. Resource characterization can be enhanced and sample representativity is ensured by imaging and quantifying the whole core volume with the Scout and Zoom workflow.
Conclusion
Equipped with FPX detector, the ZEISS Xradia 510 Versa offers a high throughput solution that has the potential for imaging large areas at high resolution. These “Scout” scans are used for identifying features and regions of interest, which are sequentially used for detecting regions of interest for additional analysis, yielding higher resolution interior tomograms to complete the “Scout and Zoom” workflow.
This research demonstrates the capability of the ZEISS Xradia 510 Versa in the identification and characterization of gold mineralization with minimum sample preparation and sample analysis. This data can further be employed as part of a workflow for guiding 2D sample preparation for quantitative gold distribution analysis, or for additional analysis using automated mineralogy.

This information has been sourced, reviewed and adapted from materials provided by Carl Zeiss Microscopy GmbH.
For more information on this source, please visit Carl Zeiss Microscopy GmbH.