Coal is currently the key energy source in China, and this condition will not change for the foreseeable future. A majority of the coal mines are underground, involving more mining risks than open-pit mining methods. There are many losses and casualties, though accidents have come down in recent years in China due to effective technology and management. This article is based on Cheng, P. et al's journal paper published in Shock and Vibration.
Image Credit: Parilov/Shutterstock.com
Rock burst is one of the dynamic disasters in coal mines. It releases so much pressure in a short time that hundreds, or even thousands, of roadways are damaged and hundreds of people are instantaneously killed. Therefore, the study of rockburst has become one of the hot spots and difficulties in coal mine research.
Normally, the monitoring and control of rockburst are carried out separately, which are mainly based on the principles of microseism. The monitoring methods include microseismic monitoring, acoustic emission monitoring, stress monitoring, electromagnetic radiation, and new detecting method such as isotope tracing to detect the roof strata, which warn the occurrence of rockburst early according to the abnormal indicators.
This study details the monitoring results using hand-held pneumatic drill rigs in different construction environments. The findings show that the drilling depth can still be reflected by the amplitude group, the pressure curve of different depths can also reflect the pressure of different depths, and the pressure relief effect of drilling can also be reflected by the number of coal vibration events of different depths.
This technology makes full use of the vibration signal collected during the construction process of pressure relief drilling, which achieves the purpose of multipurpose of one hole. Furthermore, it may directly replace the drilling cuttings’ method, which will reduce a lot of engineering costs and save some manpower.
Methodology
The test was carried out on the side of the 3306 track gateway in a coal mine of Shandong Province, China, monitoring the vibration signal during the construction of the pressure relief drilling hole. The drilling system includes a hand-held pneumatic drilling rig and several drill pipes, where the former is controlled by a worker and the latter is held by another for connection while drilling (see Figure 1).
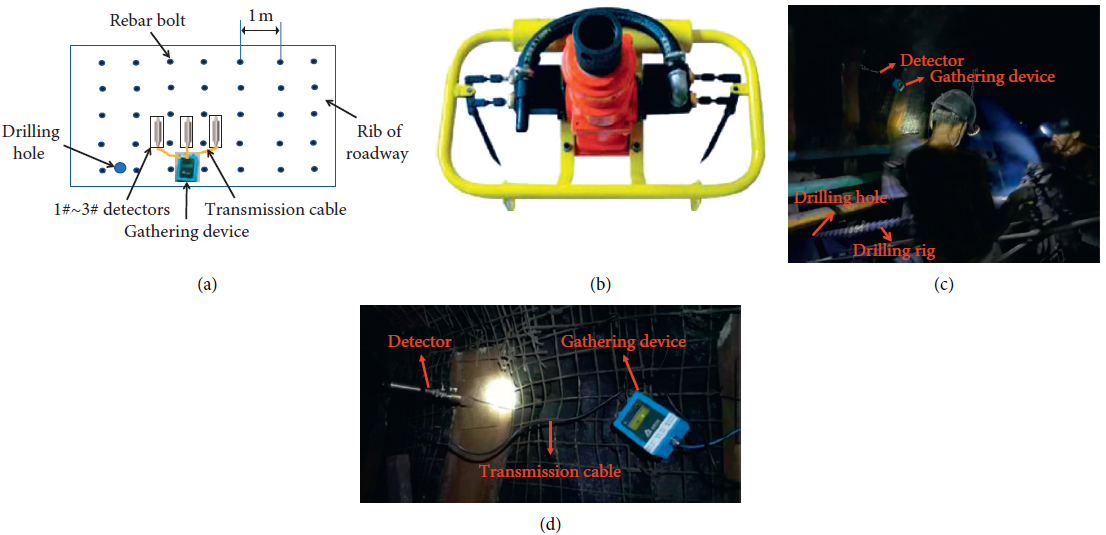
Figure 1. Test equipment and arrangement. (a) Test arrangement. (b) Hand-held pneumatic drilling rig. (c) Construction site. (d) Site arrangement. Image Credit: Cheng, et al. 2021
The parameters of the three detectors and the gathering device are shown in Tables 1 and 2, respectively.
Table 1. Parameters of the detector. Source: Cheng, et al. 2021
| Parameters |
Parameter values |
| Channel number |
1∼3 optional |
| Sampling frequency |
Single tunnel 1∼7000 Hz optional and
three tunnels 1∼2000 Hz optional |
| Timing standard |
Ground GPS satellite timing |
| Timing equipment |
High-precision clock chip |
| Data storage device |
Hard disk in device |
| Hard disk capacity |
16 G |
| Battery endurance |
More than 96 h |
| Boundary dimension |
200 mm * 280 * 110 mm |
| Isolation voltage |
1500 VAC/60 s |
Table 2. Parameters of the gathering device. Source: Cheng, et al. 2021
| Parameter |
Parameter values |
| Type |
High-frequency acquisition moving coil speed detector |
| Model |
GZC 60 |
| Measuring range |
0∼800 Hz |
| Sensitivity |
100 V/m/s |
| Normal acceleration |
50 m/s2 |
| Peak acceleration |
500 m/s2 |
| Damping coefficient |
0.6 |
Maximum transmission
distance |
50 m |
| Temperature requirements |
High: 60 °C
Low: −40 °C |
| Humidity requirements |
95% when temperature is +25 °C |
Results
The waveform of vibration signal generated during drilling pressure relief hole is shown in Figure 2, from which it can be seen that the amplitude of vibration signal is not always constant, but fluctuates with time. The amplitude in Figure 2(a) fluctuates greatly in about 0.25 seconds, which increases by nine times in a short time and then quickly falls back to the normal amplitude level.
This kind of waveform is caused by the sudden release of pressure in the coal seam, which is called a vibration event. The fluctuation time of amplitude in Figure 2(b) lasts about 1.5 seconds, which is longer than the vibration event, and the change of the waveform is gentle. This kind of waveform is caused by temporary drilling difficulties, which is called sticking.
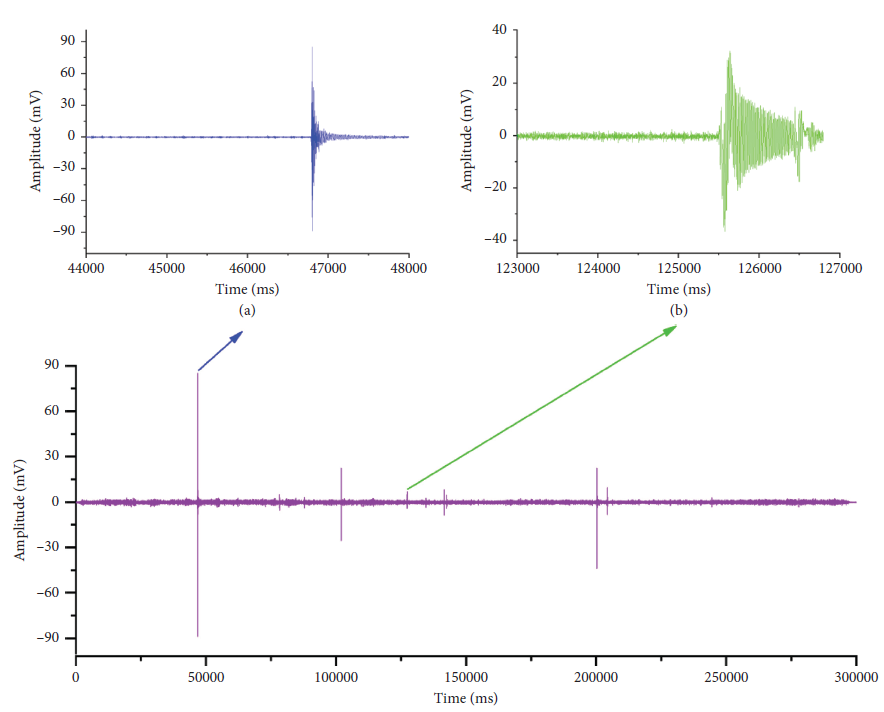
Figure 2. Waveforms measured by third detector. (a) Waveform of vibration event. (b) Waveform of sticking. Image Credit: Cheng, et al. 2021
The amplitude of sound wave attenuates with the increase of detection distance; therefore, the amplitude values measured by three detectors at the same time are different, as shown in Figures 3(a)–3(c).
However, the trend of amplitude change with time detected by the three detectors is similar. For instance, the vibration waves with the largest amplitude appear at 16:30, and there were 13 sets of amplitude groups in all three curves.
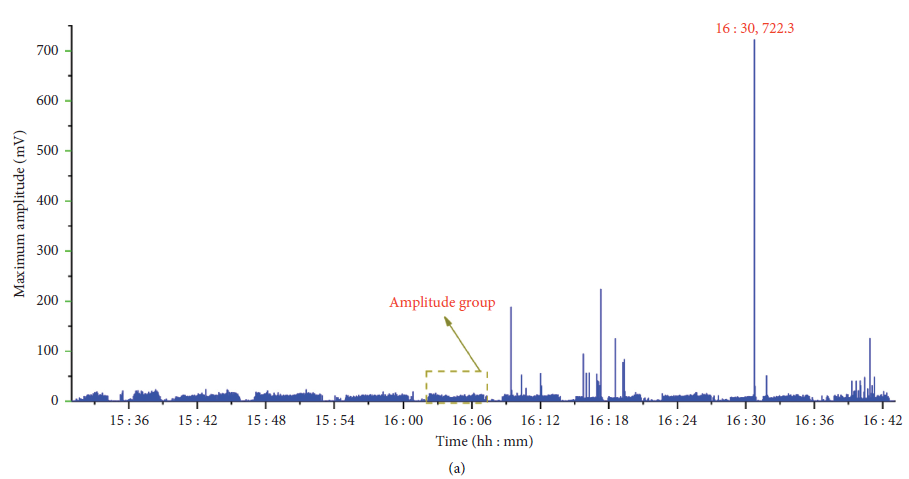
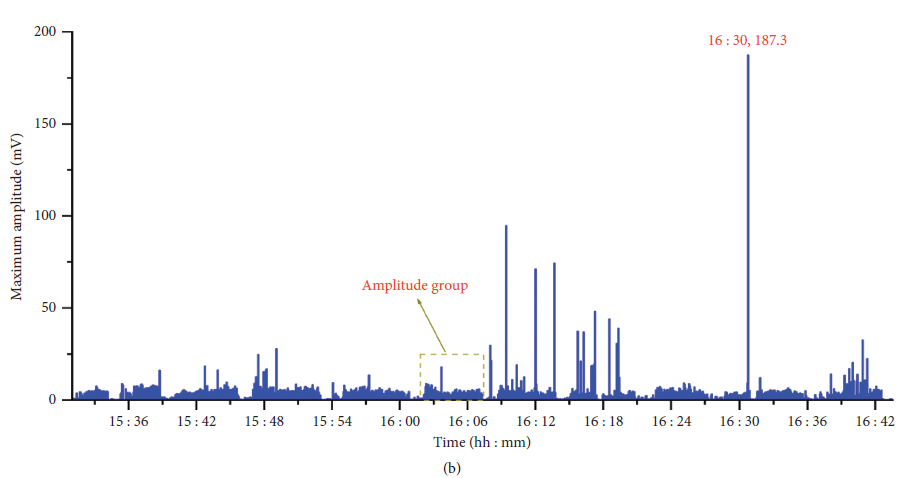
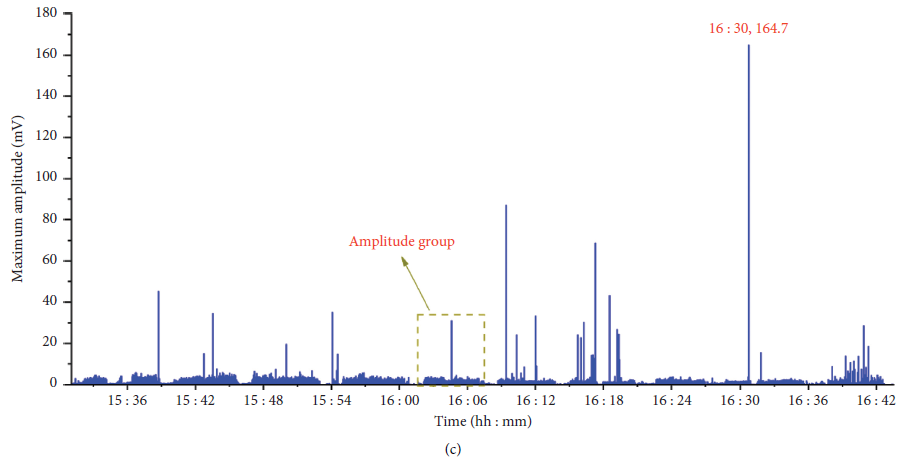
Figure 3. Variation of the maximum amplitude with time. (a) Maximum amplitude tested by the first detector. (b) Maximum amplitude tested by the second detector. (c) Maximum amplitude tested by the third detector. Image Credit: Cheng, et al. 2021
To show the drilling distance more accurately, the ordinates of the three figures in Figure 3 are reduced to form clearer pictures, as shown in Figures 4(a)–4(c). The coal seam vibrates obviously during drilling and vibrates slightly when the drilling is interrupted or the drill pipes are connected.
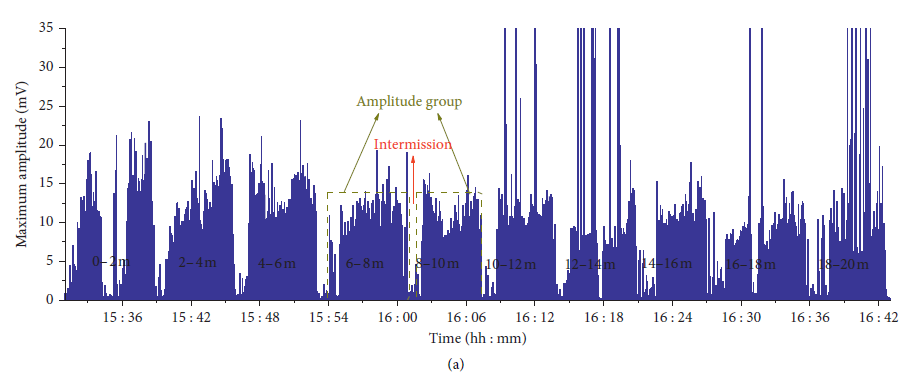
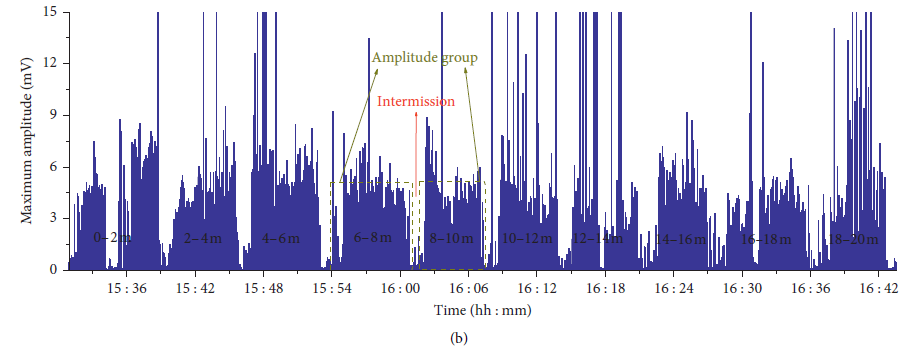
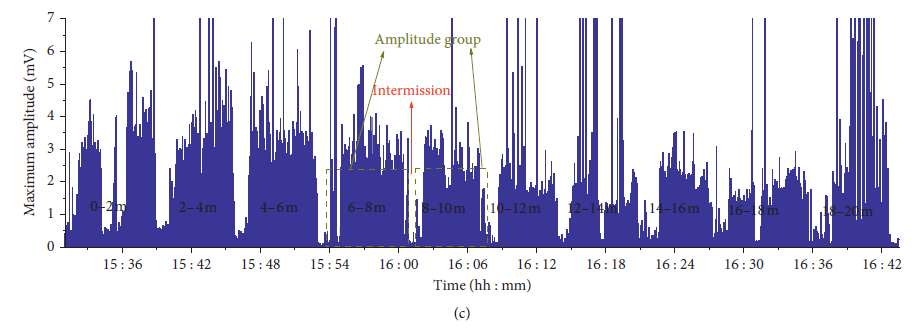
Figure 4. Amplification of maximum amplitude. (a) Amplification diagram of the first detector. (b) Amplification diagram of the second detector. (c). Amplification diagram of the third detector. Image Credit: Cheng, et al. 2021
The histogram in Figure 5 shows the number of vibration events at different drilling depths, from which it can be seen that the number of vibration events that occurred at drilling depths of 10∼12 m, 12∼14 m, 16∼18 m, and 18∼20 m is 5, 12, 2, and 21, respectively, and no vibration events occur at other depths.
The occurrence of vibration events has obvious regional characteristics, that is, some drilling depths have no vibration events, while some others with vibration events happening usually have more. In fact, the more the number of vibration events occurs, the more the energy is released, so the number of vibration events during the construction process can reflect the pressure relief degree at different depths to some extent.
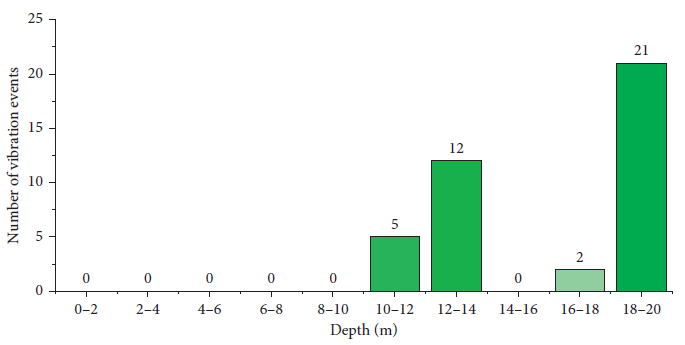
Figure 5. Number of vibration events at different drilling depths. Image Credit: Cheng, et al. 2021
The results show that this method can get the drilling depth and express the vibration events quantitatively. The average amplitude values of each amplitude group measured by the three detectors in the experiment decrease gradually with the increase of the test distance (as shown in Figure 6).
The curves of the modified average amplitude measured by the three detectors with drilling distance are shown in Figure 7. The amplitude of 12∼14 m is the lowest and that of 14∼16 m is the highest, which means that it is relatively easy to drill 12∼14 m, while difficult to drill 14∼16 m.
The comparison between Figures 6 and 7 shows that the signal attenuation has a great impact on the pressure value result, and the attenuation correction must be carried out when it comes to the application of the pressure value.
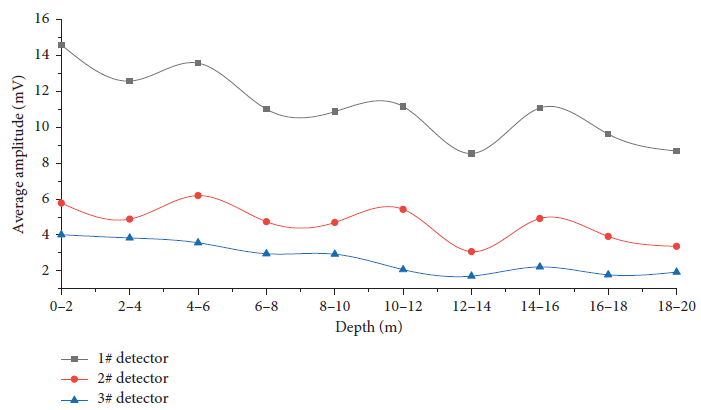
Figure 6. Variation curve of average amplitude with drilling depth. Image Credit: Cheng, et al. 2021
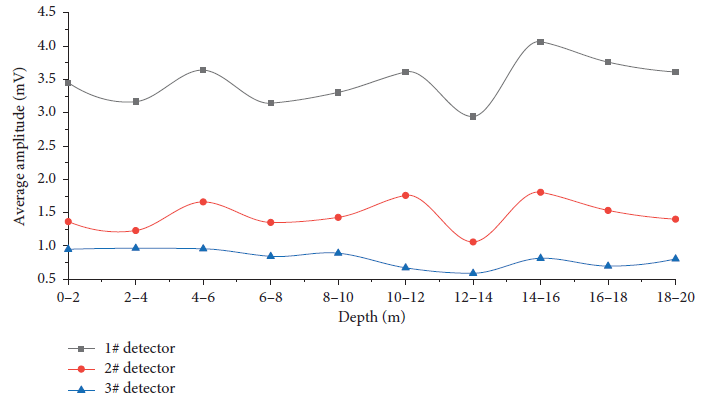
Figure 7. Variation curve of the modified amplitude value with drilling depth. Image Credit: Cheng, et al. 2021
The violin chart of amplitude fluctuation at different depths in Figure 8 shows the difficulty of constructing each drill pipe.
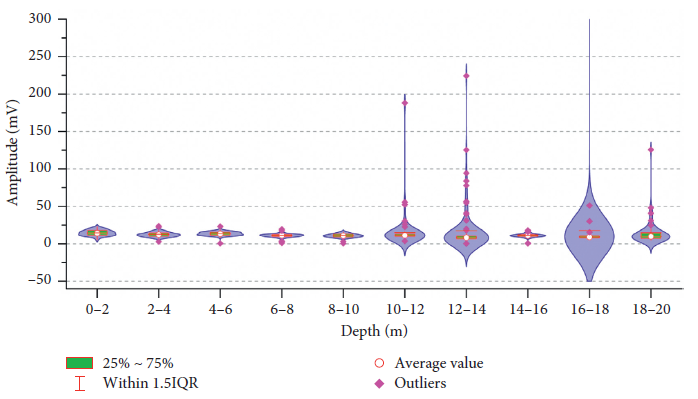
Figure 8. Distribution statistics of amplitude values in each amplitude group. Image Credit: Cheng, et al. 2021
The method proposed in this study can quantitatively reflect the drilling depth, which is of great significance for the mine’s automatic supervision and inspection of drilling quantities and lays an important foundation for the realization of intelligent mine.
However, this method has some shortcomings. For example, if the drilling is suspended during constructing one drill pipe due to the workers’ operation or other situations on-site, there will be errors in the depth statistics, which leads to errors in the subsequent statistics of vibration events and pressure conditions at different depths. However, from the actual situation of the site, this situation is less and the impact on the error is limited.
Conclusion
The applicability of the signal acquisition method under the condition of a hand-held pneumatic drilling rig is verified by collecting the vibration signal generated during the construction of the pressure relief hole. The analysis of the test signal can give the following information:
- The number of amplitude groups can specify the number of construction drill pipes, and the real depth of pressure relief drilling can be estimated, which supports the intelligent management of mine construction.
- The average amplitude of different depths and distribution of outliers can indicate the drilling difficulty of different depths and the geological conditions of coal seam.
- The number of vibration events in different depths can be identified from the statistic on their waveform, which can be used to assess the effect of drilling pressure relief holes.
Journal Reference:
Cheng, P., Zhang, W., Li, W., He, J., Feng, Y. (2021) Vibration Behavior during Underground Drilling Based on an Innovative Measurement Method and the Application. Shock and Vibration. Available at: https://doi.org/10.1155/2021/6489298.
References and Further Reading
- Meifeng, C (2020) Key theories and technologies for surrounding rock stability and ground control in deep mining. Journal of Mining and Strata Control Engineering, vol. 2, no. 3.
- Li, X., et al. (2020) Characteristics and trends of coal mine safety development. Energy Sources, Part A: Recovery, Utilization, and Environmental Effects, vol. 12, pp. 1–19. doi.org/10.1080/15567036.2020.1852339.
- Keneti, A & Sainsbury, B-A (2018) Review of published rockburst events and their contributing factors. Engineering Geology, vol. 246, pp. 361–373. doi.org/10.1016/j.enggeo.2018.10.005.
- Hassani, B., et al. (2019) Comparison of site dominant frequency from earthquake and microseismic data in California. Bulletin of the Seismological Society of America, vol. 109, no. 3, pp. 1034–1040. doi.org/10.1785/0120180267.
- Mark, C (2018) Coal bursts that occur during development: a rock mechanics enigma. International Journal of Mining Science and Technology, vol. 28, no. 1, pp. 35–42. doi.org/10.1016/j.ijmst.2017.11.014.
- Jiang, L., et al. (2019) Dynamic analysis of the rock burst potential of a longwall panel intersecting with a fault. Rock Mechanics and Rock Engineering, vol. 53, no. 4, pp. 1737–1754. doi.org/10.1007/s00603-019-02004-2.
- Zhang, W., et al. (2020) Mechanism of rock burst revealed by numerical simulation and energy calculation. Shock and Vibration, vol. 2020, pp. 1–15. doi.org/10.1155/2020/8862849.
- Xiufeng, Z., et al. (2021) Development and application of multi-dimension multi-parameter monitoring and early warning platform of coal bursts. Journal of Mining and Strata Control Engineering, vol. 3, no. 01, pp. 69–78.
- Zhang, W., et al. (2021) Peak particle velocity of vibration events in underground coal mine and their caused stress increment. Measurement, vol. 169, Article ID 108520. doi.org/10.1016/j.measurement.2020.108520.
- Li, X., et al. (2016) Extraction of microseismic waveforms characteristics prior to rock burst using Hilbert-Huang transform. Measurement, vol. 91, pp. 101–113. doi.org/10.1016/j.measurement.2016.05.045.
- Zhang, W., et al. (2019) Fracture analysis of multi-hard roofs based on microseismic monitoring and control techniques for induced rock burst: a case study. Arabian Journal of Geosciences, vol. 12, no. 24, p. 784. doi.org/10.1007/s12517-019-4972-1.
- Dou, L., et al. (2012) Mechanism and prevention methods discussion on coal mine rock burst induced by dynamic load. In: Proceedings of the High Level Academic Forum on the 50th Anniversary of the Founding of China Coal Association, China.
- Pan, J (2019) Theory of rockburst start-up and its complete technology system. Journal of China Coal Society, vol. 44, no. 1, pp. 173–182. doi.org/10.13225/j.cnki.jccs.2018.1156.
- Cook, N G W (1966) Rock Mechanics Applied to the Study of Rock Burst. J.S. Aft, Johannesburg, South Africa.
- Kritische, B G (1975) Spannungen in Kohlenflozen, Gluckauf.
- Ma, K., et al. (2016) Stability analysis of underground oil storage caverns by an integrated numerical and microseismic monitoring approach. Tunnelling and Underground Space Technology, vol. 54, pp. 81–91. doi.org/10.1016/j.tust.2016.01.024.
- Liu, X., et al. (2021) Failure evolution and instability mechanism of surrounding rock for close-distance parallel chambers with super-large section in deep coal mines. International Journal of Geomechanics, vol. 21, no. 5, Article ID 04021049. doi.org/10.1061/(ASCE)GM.1943-5622.0001998.
- Liu, X., et al. (2021) Similar simulation study on the deformation and failure of surrounding rock of a large section chamber group under dynamic loading. International Journal of Mining Science and Technology, vol. 31, no. 3, pp. 495–505. doi.org/10.1016/j.ijmst.2021.03.009.
- Zhang, W. C., et al. (2021) A new monitoring-while-drilling method of large diameter drilling in underground coal mine and their application. Measurement, vol. 173, Article ID 108840. doi.org/10.1016/j.measurement.2020.108840.
- Liu, X., et al. (2018) Microseismic monitoring and stability analysis of the right bank slope at Dagangshan hydropower station after the initial impoundment. International Journal of Rock Mechanics and Mining Sciences, vol. 108, pp. 128–141. doi.org/10.1016/j.ijrmms.2018.06.012.
- Lu, C.-P., et al. (2013) Microseismic frequency-spectrum evolutionary rule of rockburst triggered by roof fall. International Journal of Rock Mechanics and Mining Sciences, vol. 64, pp. 6–16. doi.org/10.1016/j.ijrmms.2013.08.022.
- Manthei, G & Plenkers, K (2018) Review on in situ acoustic emission monitoring in the context of structural health monitoring in mines. Applied Sciences, vol. 8, p. 1595. doi.org/10.3390/app8091595.
- Dou, L., (2020) Fracture behavior and acoustic emission characteristics of sandstone samples with inclined precracks. International Journal of Coal Science & Technology, vol. 8, no. 1, pp. 77–87. doi.org/10.1007/s40789-020-00344-x.
- Xie, J., et al. (2018) Mining-induced stress distribution of the working face in a kilometer-deep coal mine-a case study in Tangshan coal mine. Journal of Geophysics and Engineering, vol. 15, no. 5, pp. 2060–2070. doi.org/10.1088/1742-2140/aabc6c.
- Liu, S., et al. (2018) Research on the risk hierarchical assessment of rock burst of heading face based on acoustic emission and electromagnetic wave CT system. Journal of China Coal Society, vol. 43.
- Liu, X., et al. (2021) New detecting method on the connecting fractured zone above the coal face and a case study. Rock Mechanics and Rock Engineering, vol. 5. doi.org/10.1007/s00603-021-02487-y.
- Zhang, W., et al. (2021) Vibration events in underground heading face and useful index for rock burst monitoring. Measurement, vol. 180, Article ID 109501. doi.org/10.1016/j.measurement.2021.109501.
- Ning, J., et al. (2017) Fracture analysis of double-layer hard and thick roof and the controlling effect on strata behavior: a case study. Engineering Failure Analysis, vol. 81, pp. 117–134. doi.org/10.1016/j.engfailanal.2017.07.029.
- Li, Q., et al. (2014) The effect of pulse frequency on the fracture extension during hydraulic fracturing. Journal of Natural Gas Science and Engineering, vol. 21, pp. 296–303. doi.org/10.1016/j.jngse.2014.08.019.
- Yongxue, X., et al. (2020) Experimental study on hydraulic reaming of gutters in coal seam with impact pressure. Journal of Mining and Strata Control Engineering, vol. 2, no. 1, pp. 84–91.
- Yao, L & Gang, D (2020) Reasonable width of narrow coal pillars in roadway driving with gas drainage hole. Journal of Mining and Strata Control Engineering, vol. 2, no. 1.
- Li, C., et al. (2020) A case study on asymmetric deformation mechanism of the reserved roadway under mining influences and its control techniques. Geomechanics and Engineering, vol. 22, no. 5, pp. 449–460. doi.org/10.12989/gae.2020.22.5.449.
- Liu, Y., et al. (2019) Torsional stick-slip vibrations and multistability in drill-strings. Applied Mathematical Modelling, vol. 76, pp. 545–557. doi.org/10.1016/j.apm.2019.06.012.
- Srivastava, S & Teodoriu, C (2019) An extensive review of laboratory scaled experimental setups for studying drill string vibrations and the way forward. Journal of Petroleum Science and Engineering, vol. 182, Article ID 106272. doi.org/10.1016/j.petrol.2019.106272.
- Hassani, H., et al. (2018) Migration-based microseismic event location in the Schlema-Alberoda mining area. International Journal of Rock Mechanics and Mining Sciences, vol. 110, pp. 161–167. doi.org/10.1016/j.ijrmms.2018.08.002.
- Babaei Khorzoughi, M., et al. (2018) Rock fracture density characterization using measurement while drilling (MWD) techniques. International Journal of Mining Science and Technology, vol. 28, no. 6, pp. 859–864. doi.org/10.1016/j.ijmst.2018.01.001.
- Hatherly, P., et al. (2015) Drill monitoring results reveal geological conditions in blasthole drilling. International Journal of Rock Mechanics and Mining Sciences, vol. 78, pp. 144–154. doi.org/10.1016/j.ijrmms.2015.05.006.
- Zhang, W., et al. (2020) Measurement and application of vibration signals during pressure relief hole construction using microseismic system. Measurement, vol. 158, Article ID 107696. doi.org/10.1016/j.measurement.2020.107696.
- Zhai, C., et al. (2018) Investigation of the discharge law for drill cuttings used for coal outburst prediction based on different borehole diameters under various side stresses. Powder Technology, vol. 325, pp. 396–404. doi.org/10.1016/j.powtec.2017.11.003.
- Zhu, L., et al. (2014) Measuring stress and strength of coal by drilling cutting torque method. Chinese Journal of Geotechnical Engineering, vol. 36, pp. 2096–2102.
- Yinhui, Z., et al. (2004) Theory analysis and experimental study of the spread and attenuation of acoustic emission in rock body. Journal of China Coal Society, vol. 29, Article ID 131762401.