China has 36 coal mines with a production capacity of more than 10 Mt/a, with a total capacity of 612 Mt/a. Three of these mines, Hongliulin, Zhangjiamao, and Ningtiaota coal mines, are located in the Shennan mining region.
Image Credit: Parilov/Shutterstock.com
The Ningtiaota Coal Mine is a massive and major coal mine with a production capacity of 12 Mt/a. This mine has piqued the interest of many scholars because of its unique characteristics and representativeness. Their findings served as a model for other coal mines’ water resource management and water inrush control.
Researchers used Bayes discriminant analysis and Fisher discriminant analysis (FDA) to create a mine-water source-identification model, and they evaluated the different models’ relevant circumstances, sample size, accuracy, and identification capabilities.
Mine-water inflow source discrimination has a positive impact on water resource preservation, development, and usage, coal mine safety, and ecological and environmental protection. It can also give theoretical assistance for developing water-conserving coal-mining designs and preventing water inflows.
Water inrush in mines, in particular, causes more catastrophic and frequent disasters, posing serious hazards to human life and property. The weathering zone of the bedrock was the source of the water inrush. The principal source of water inrush was the weathered bedrock aquifer, which reached the working face through the caving cracks.
The conventional hydrochemistry technique, the isotope method, the tracer test method, the trace element method, and the water temperature and water level method are all examples of hydrogeochemical characteristic analysis methods. To immediately determine the source of water inrush, laser-induced fluorescence technologies, GIS, and temperature analysis have been implemented.
For the first time, a self-organizing feature map (SOM) was used to distinguish mine-water inrush sources in this investigation. From a quantitative and qualitative standpoint, the FDA, the Piper diagram, the Gibbs diagram, and the water temperature were also employed to examine and validate the water input source.
The origins of the unidentified water samples were discovered. When water gushing or indicators of water gushing develop in a mine, real-time detection should be used to swiftly determine the kind of water source.
The study of regional hydrogeochemical impacts and the replenishment and drainage interaction between groundwater and surface water would benefit greatly from this research. This study provides a solid foundation for mine-water hazard prediction and water source forecasting and prevention. It provides theoretical support as well as a practical foundation for policy formation and the mitigation of mine-water hazards.
Methodology
Ningtiaota Coal Mine is located in Shenmu County, Yulin City, Shaanxi Province, and is in the southern section of the Shennan mining area (38°57′24′′–39°07′57′′ N, 110°09′29′′–110°16′23′′ E) (Figure 1). The geological structure of this region is simple; the whole area is a monoclinic layer oriented west, with no faults or magmatic rocks visible. Figure 1 depicts a stratigraphic map of the area.
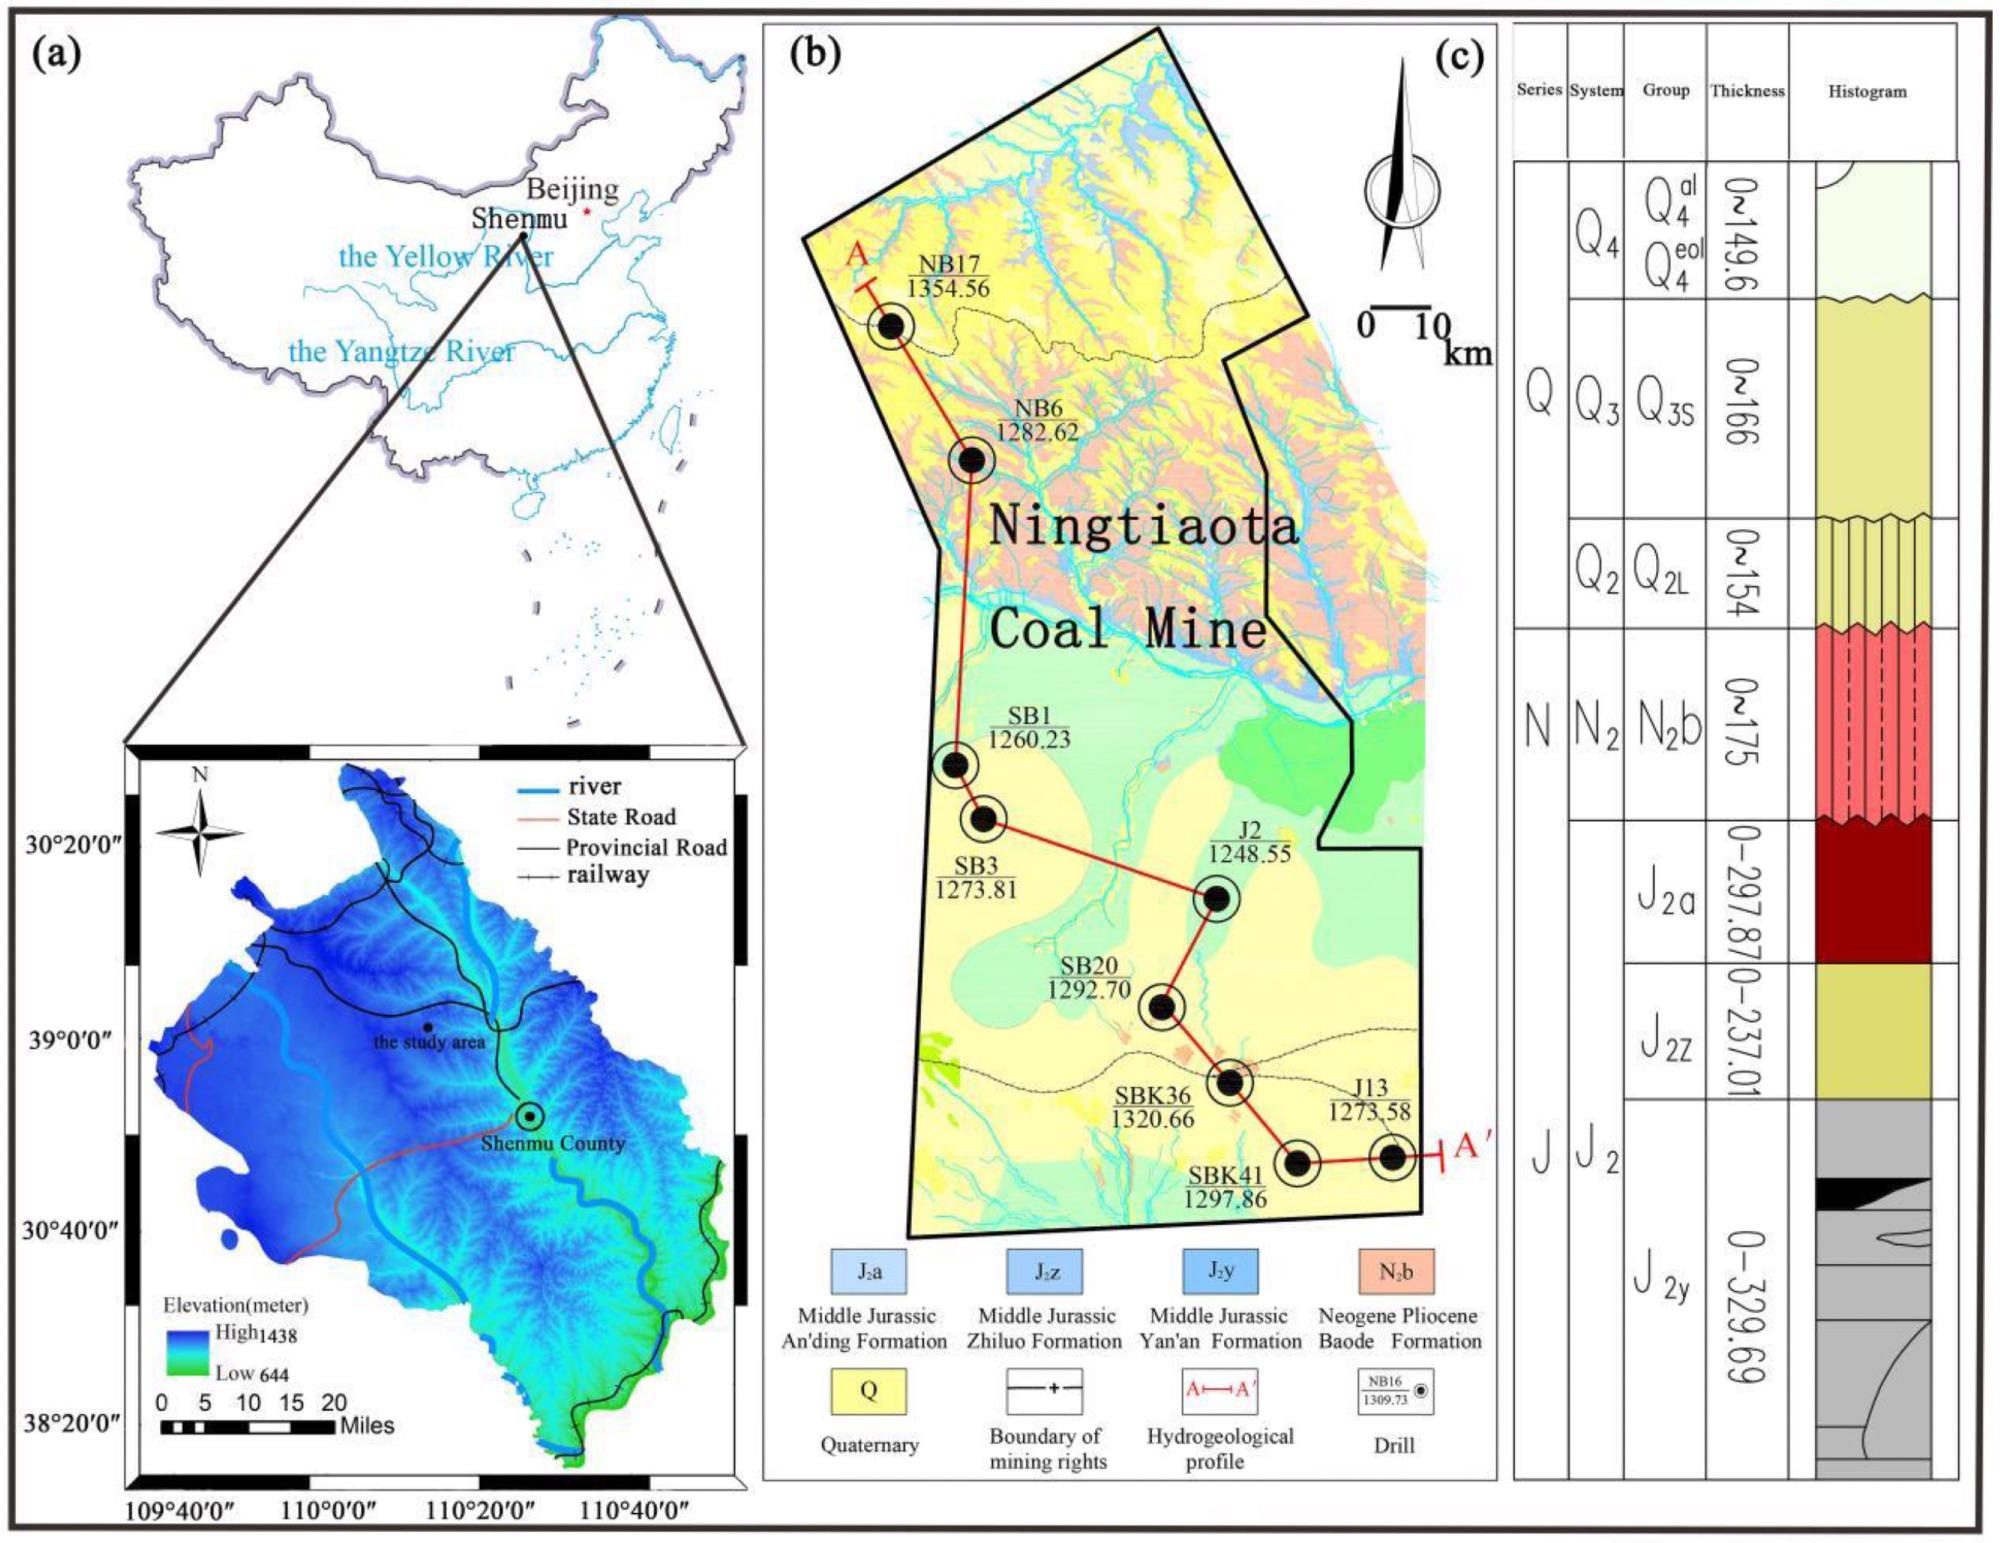
Figure 1. Map of the study area and the stratigraphic map ((a) Geographical location of the coal mine. (b) Hydrogeologic profile. (c) stratigraphic map). Image Credit: Zhao, et al., 2022
Quaternary loose-pore phreatic aquifers (Q), weathered-fissure water of layered clastic rocks from the Middle Jurassic Anding Formation (J2a) and Zhiluo Formation (J2z), fissure-confined water from the Middle Jurassic Yan’an Formation (J2y), and phreatic aquifers of burnt-rock fissure holes are the most common water-filled aquifers (Figure 2).
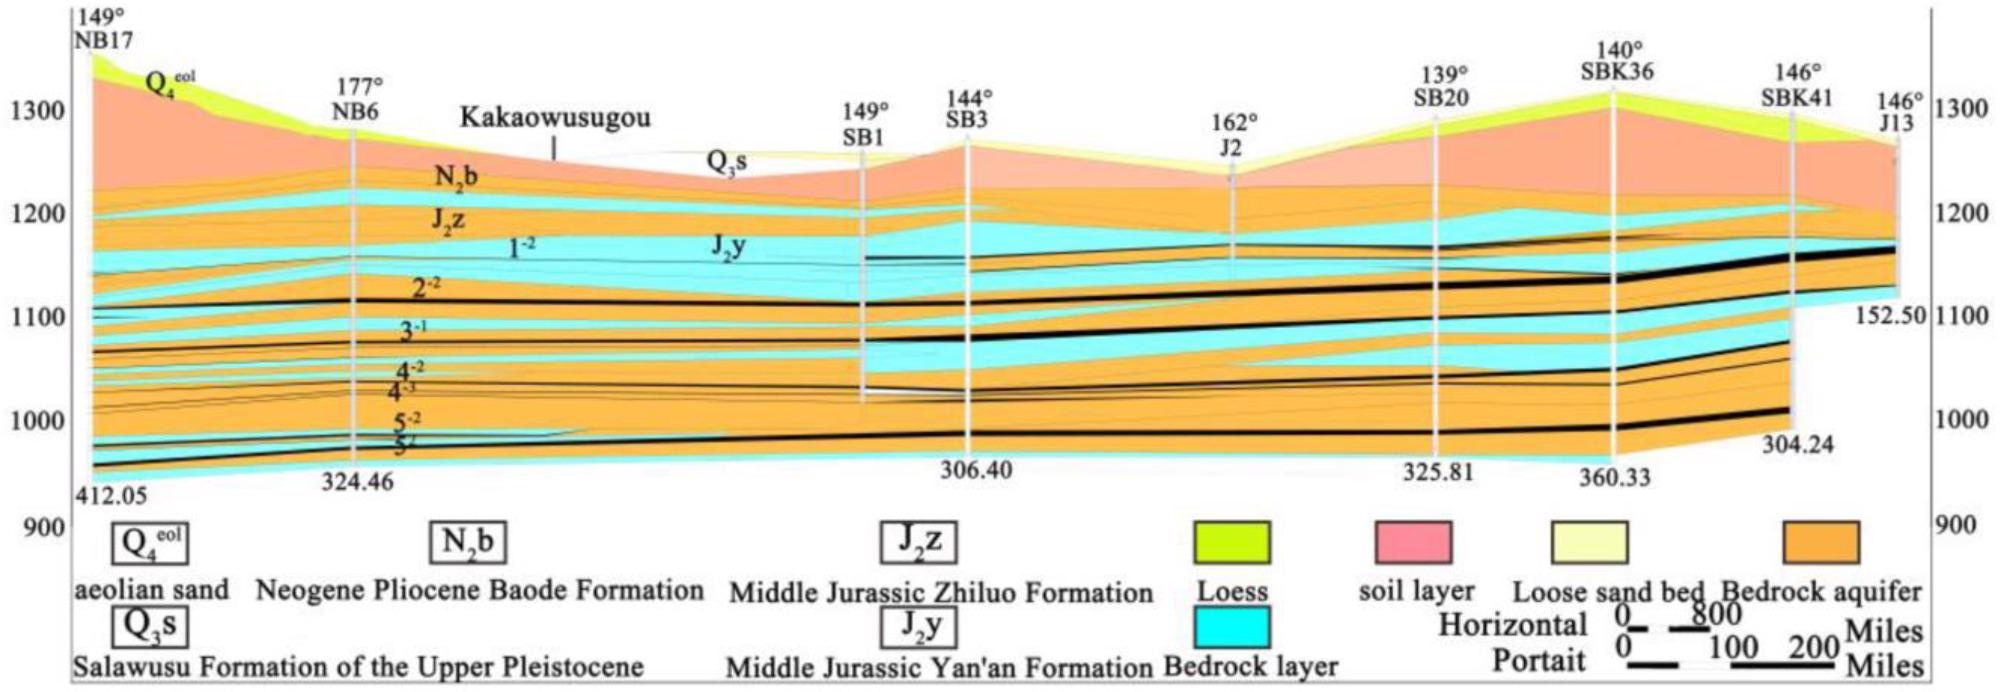
Figure 2. Hydrogeological profile. Image Credit: Zhao, et al., 2022
The concepts of dimensionality reduction and projection are used in Fisher discriminant analysis. Its goal is to project high-dimensional training-sample data in an appropriate direction onto a low-dimensional environment.
Results
Figure 3 shows a neural matrix depiction of the individual indices in the SOM. TDS, Cl-, K+ + Na+, Ca2+, Mg2+, and SO42- all showed the same color gradient, indicating that the distributions of these ions were highly comparable and that the correlations between them were quite strong.
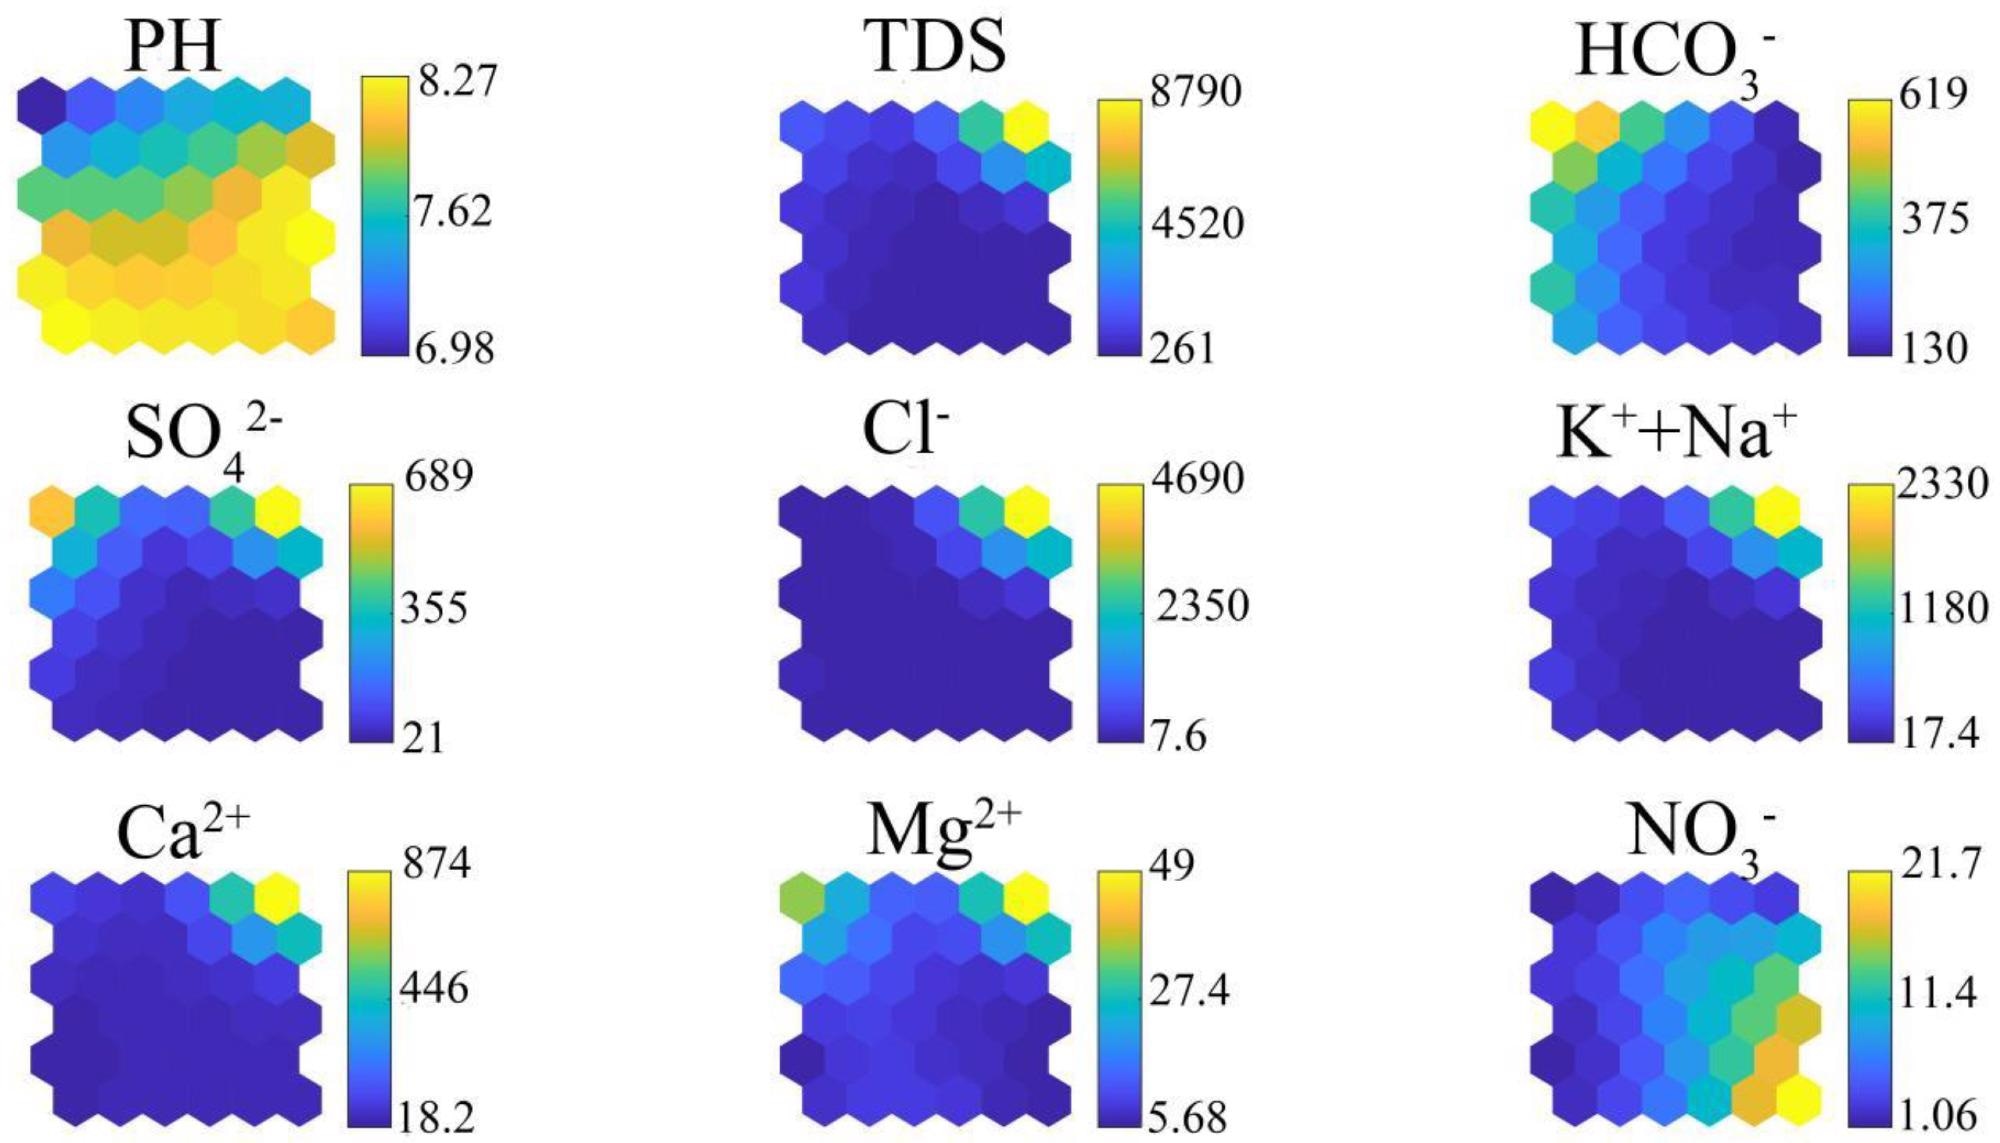
Figure 3. Neural matrix visualization of the SOM for individual indexes—pH, TDS, HCO3−, SO42−, Cl−, K+ + Na+, Ca2+, Mg2+, and NO3−—in all samples. Image Credit: Zhao, et al., 2022
A SOM neural network clustering pattern classification map with five clusters was created by clustering based on the shortest DBI index (Figure 4).
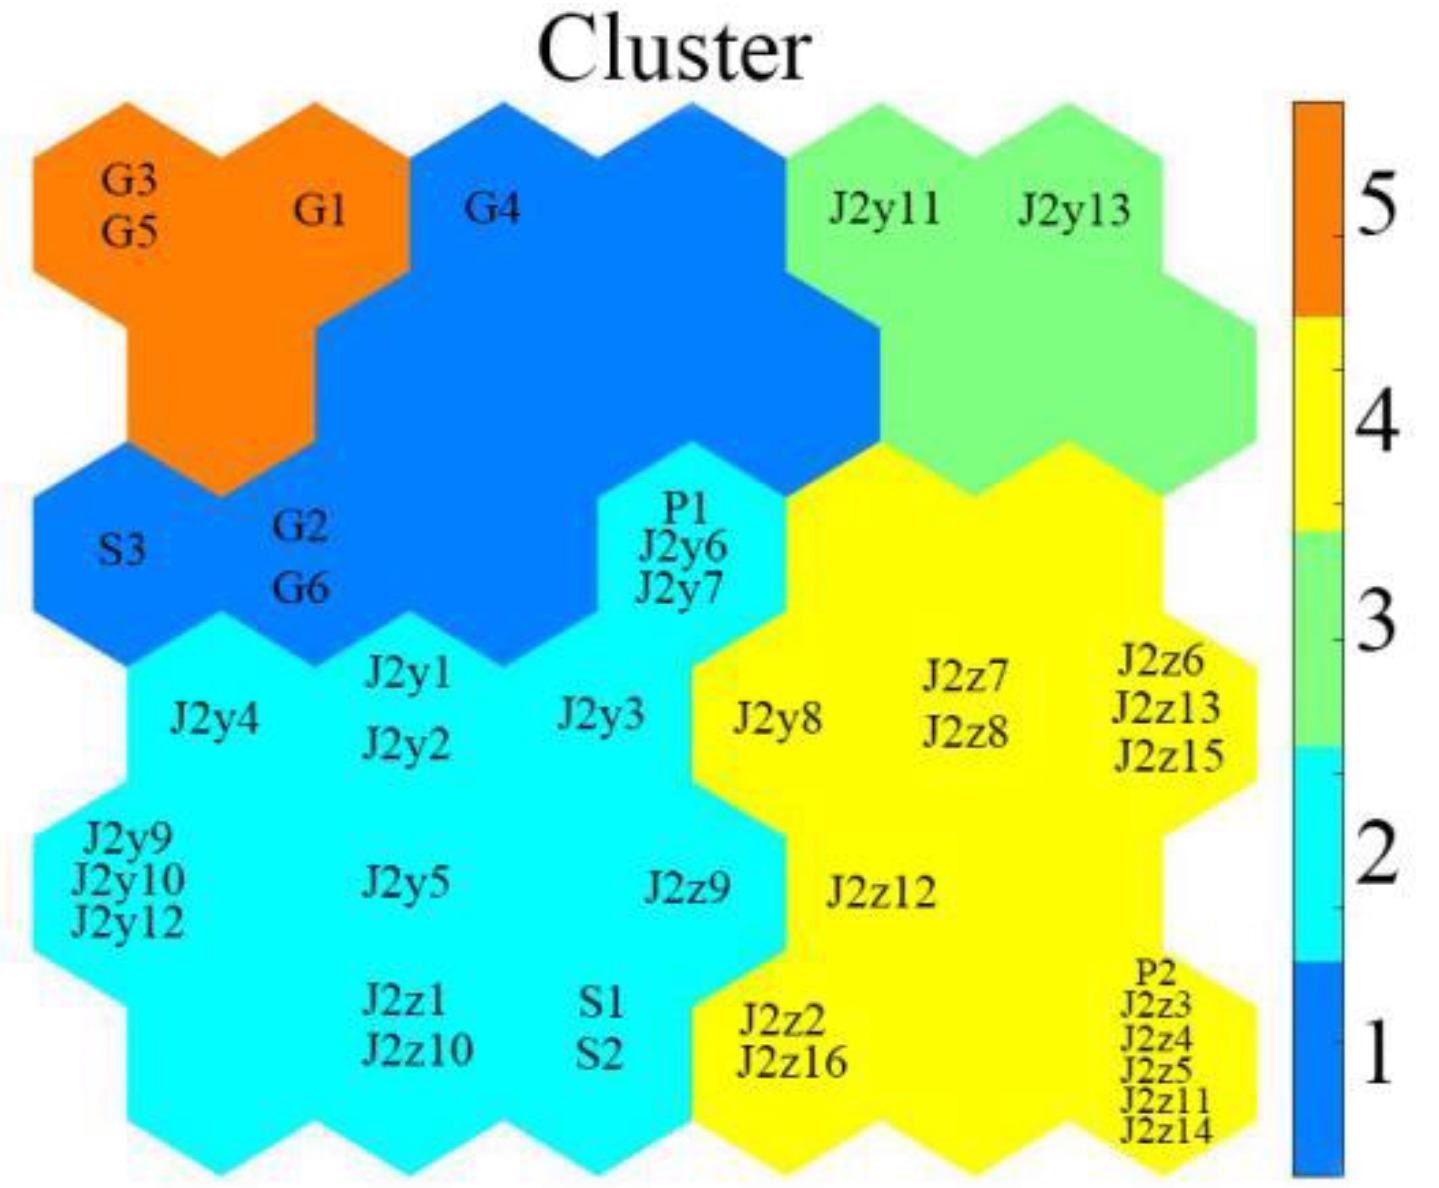
Figure 4. SOM neural network clustering pattern classification map. Image Credit: Zhao, et al., 2022
To examine the hydrogeochemical features of the samples, AqQA was used to create a Piper trilinear diagram (Figure 5).
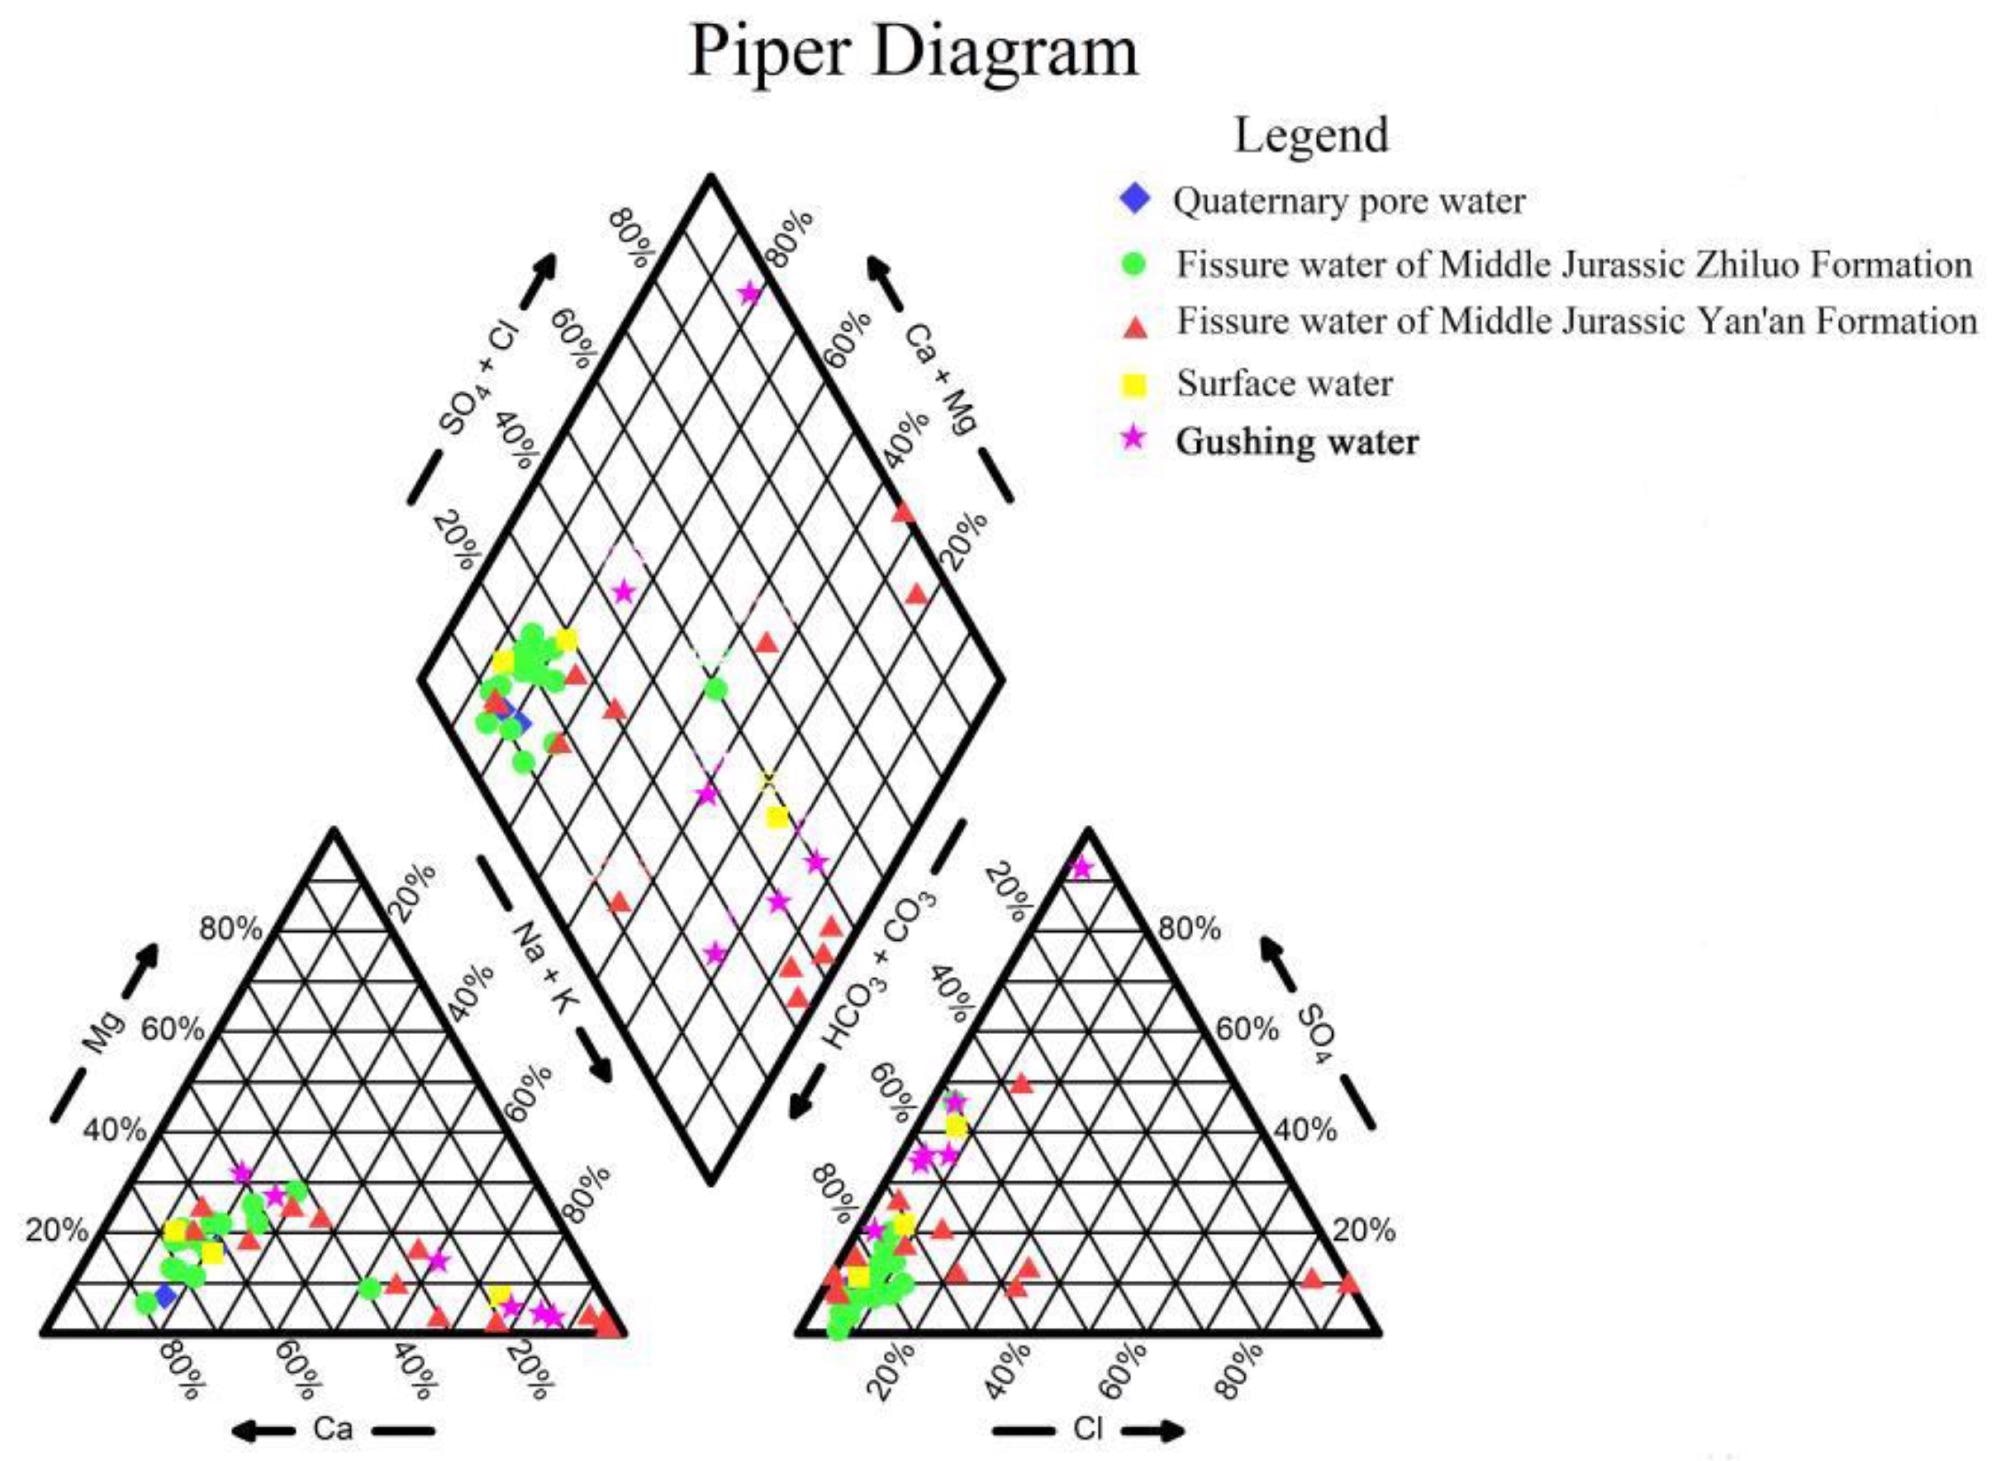
Figure 5. Piper trilinear diagram. Image Credit: Zhao, et al., 2022
Gibbs diagrams were also used to separate natural water into three primary categories based on its ionic components: evaporation dominance, rock-weathering dominance, and precipitation dominance (Figure 6).
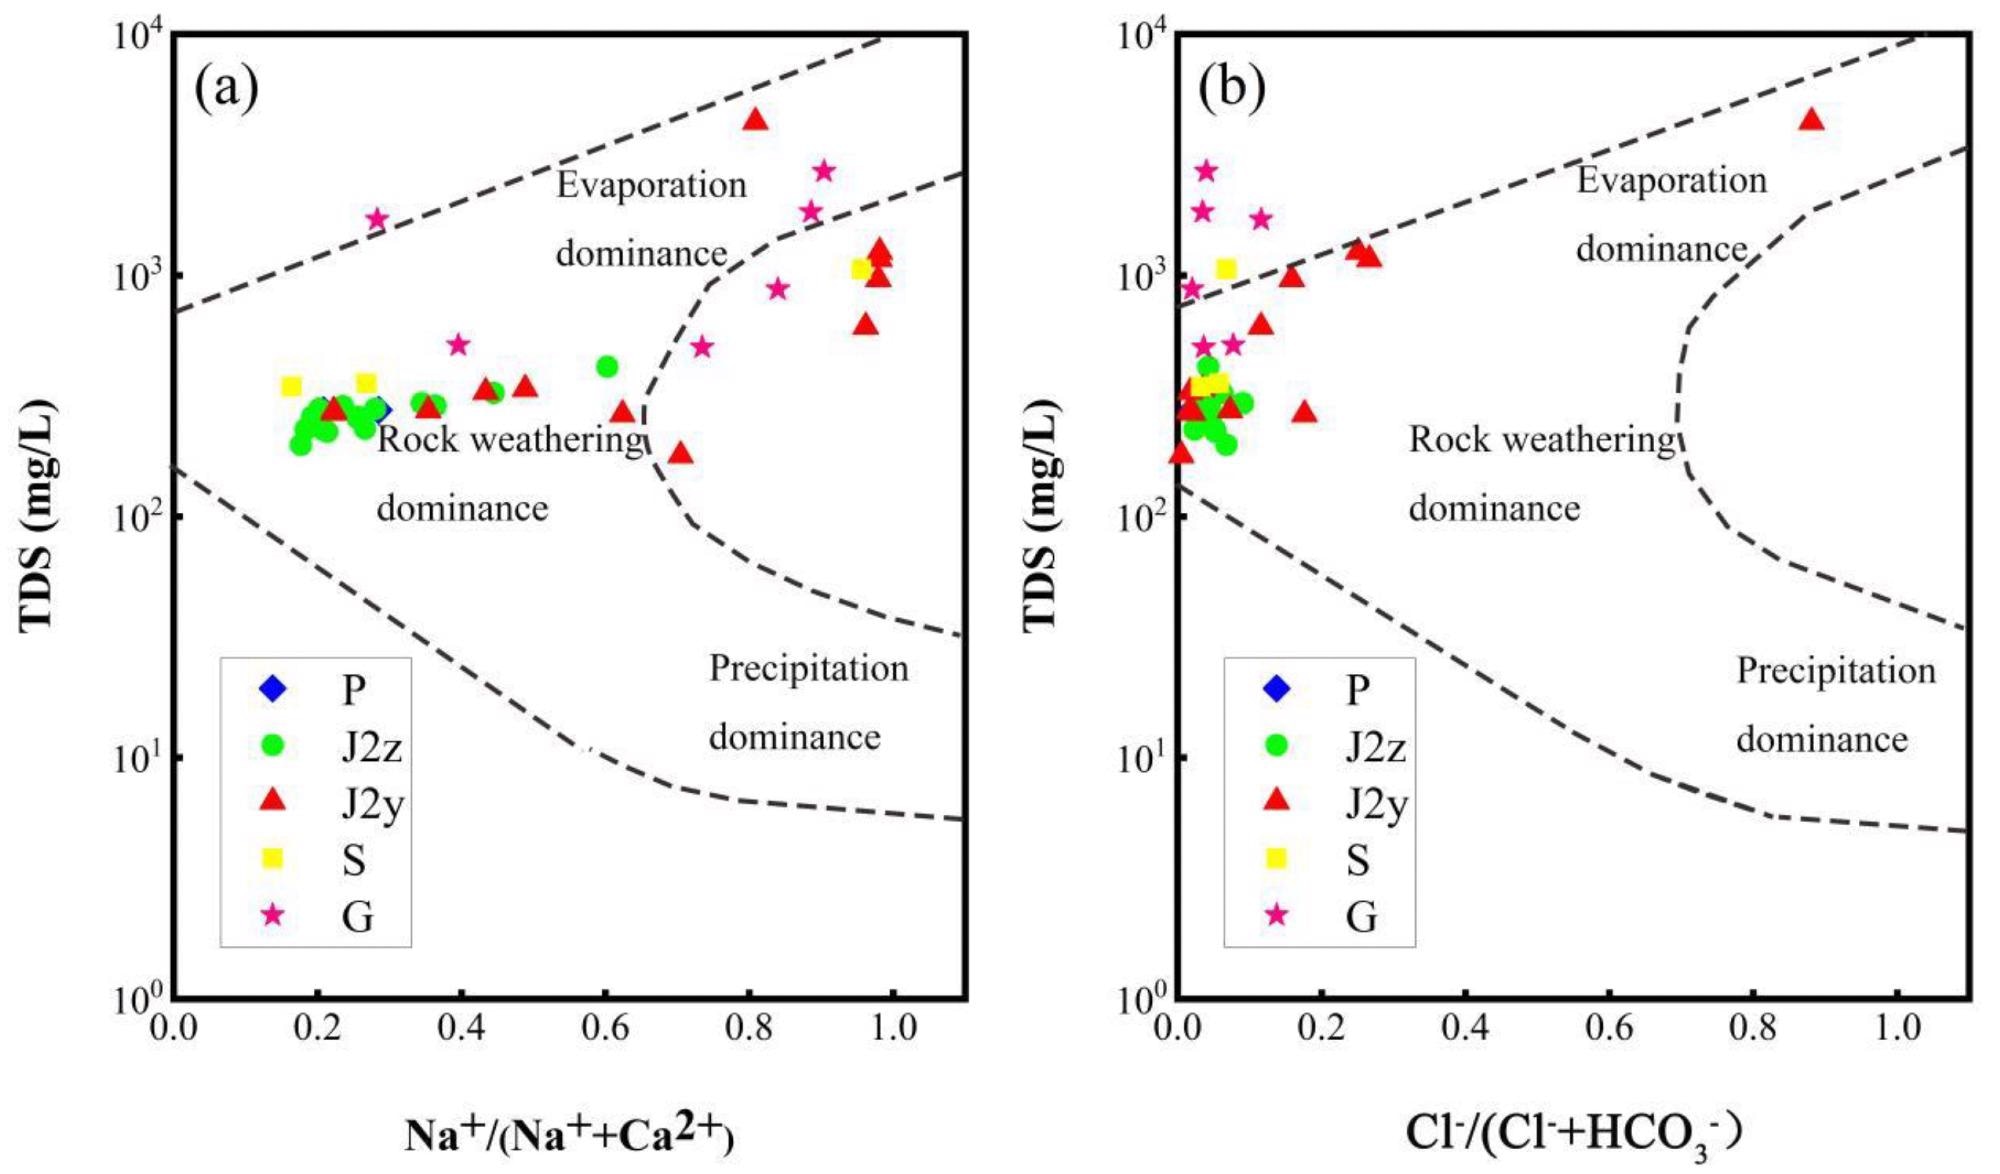
Figure 6. Gibbs diagrams. Image Credit: Zhao, et al., 2022
Both discrimination functions were used to compute the geographical distribution of water samples. Figure 7 shows the water sample types as Quaternary pore water (P), Middle Jurassic Yan’an Formation fissure water (J2y), surface water (S), and Middle Jurassic Zhiluo Formation fissure water (Zhiluo) (J2z).
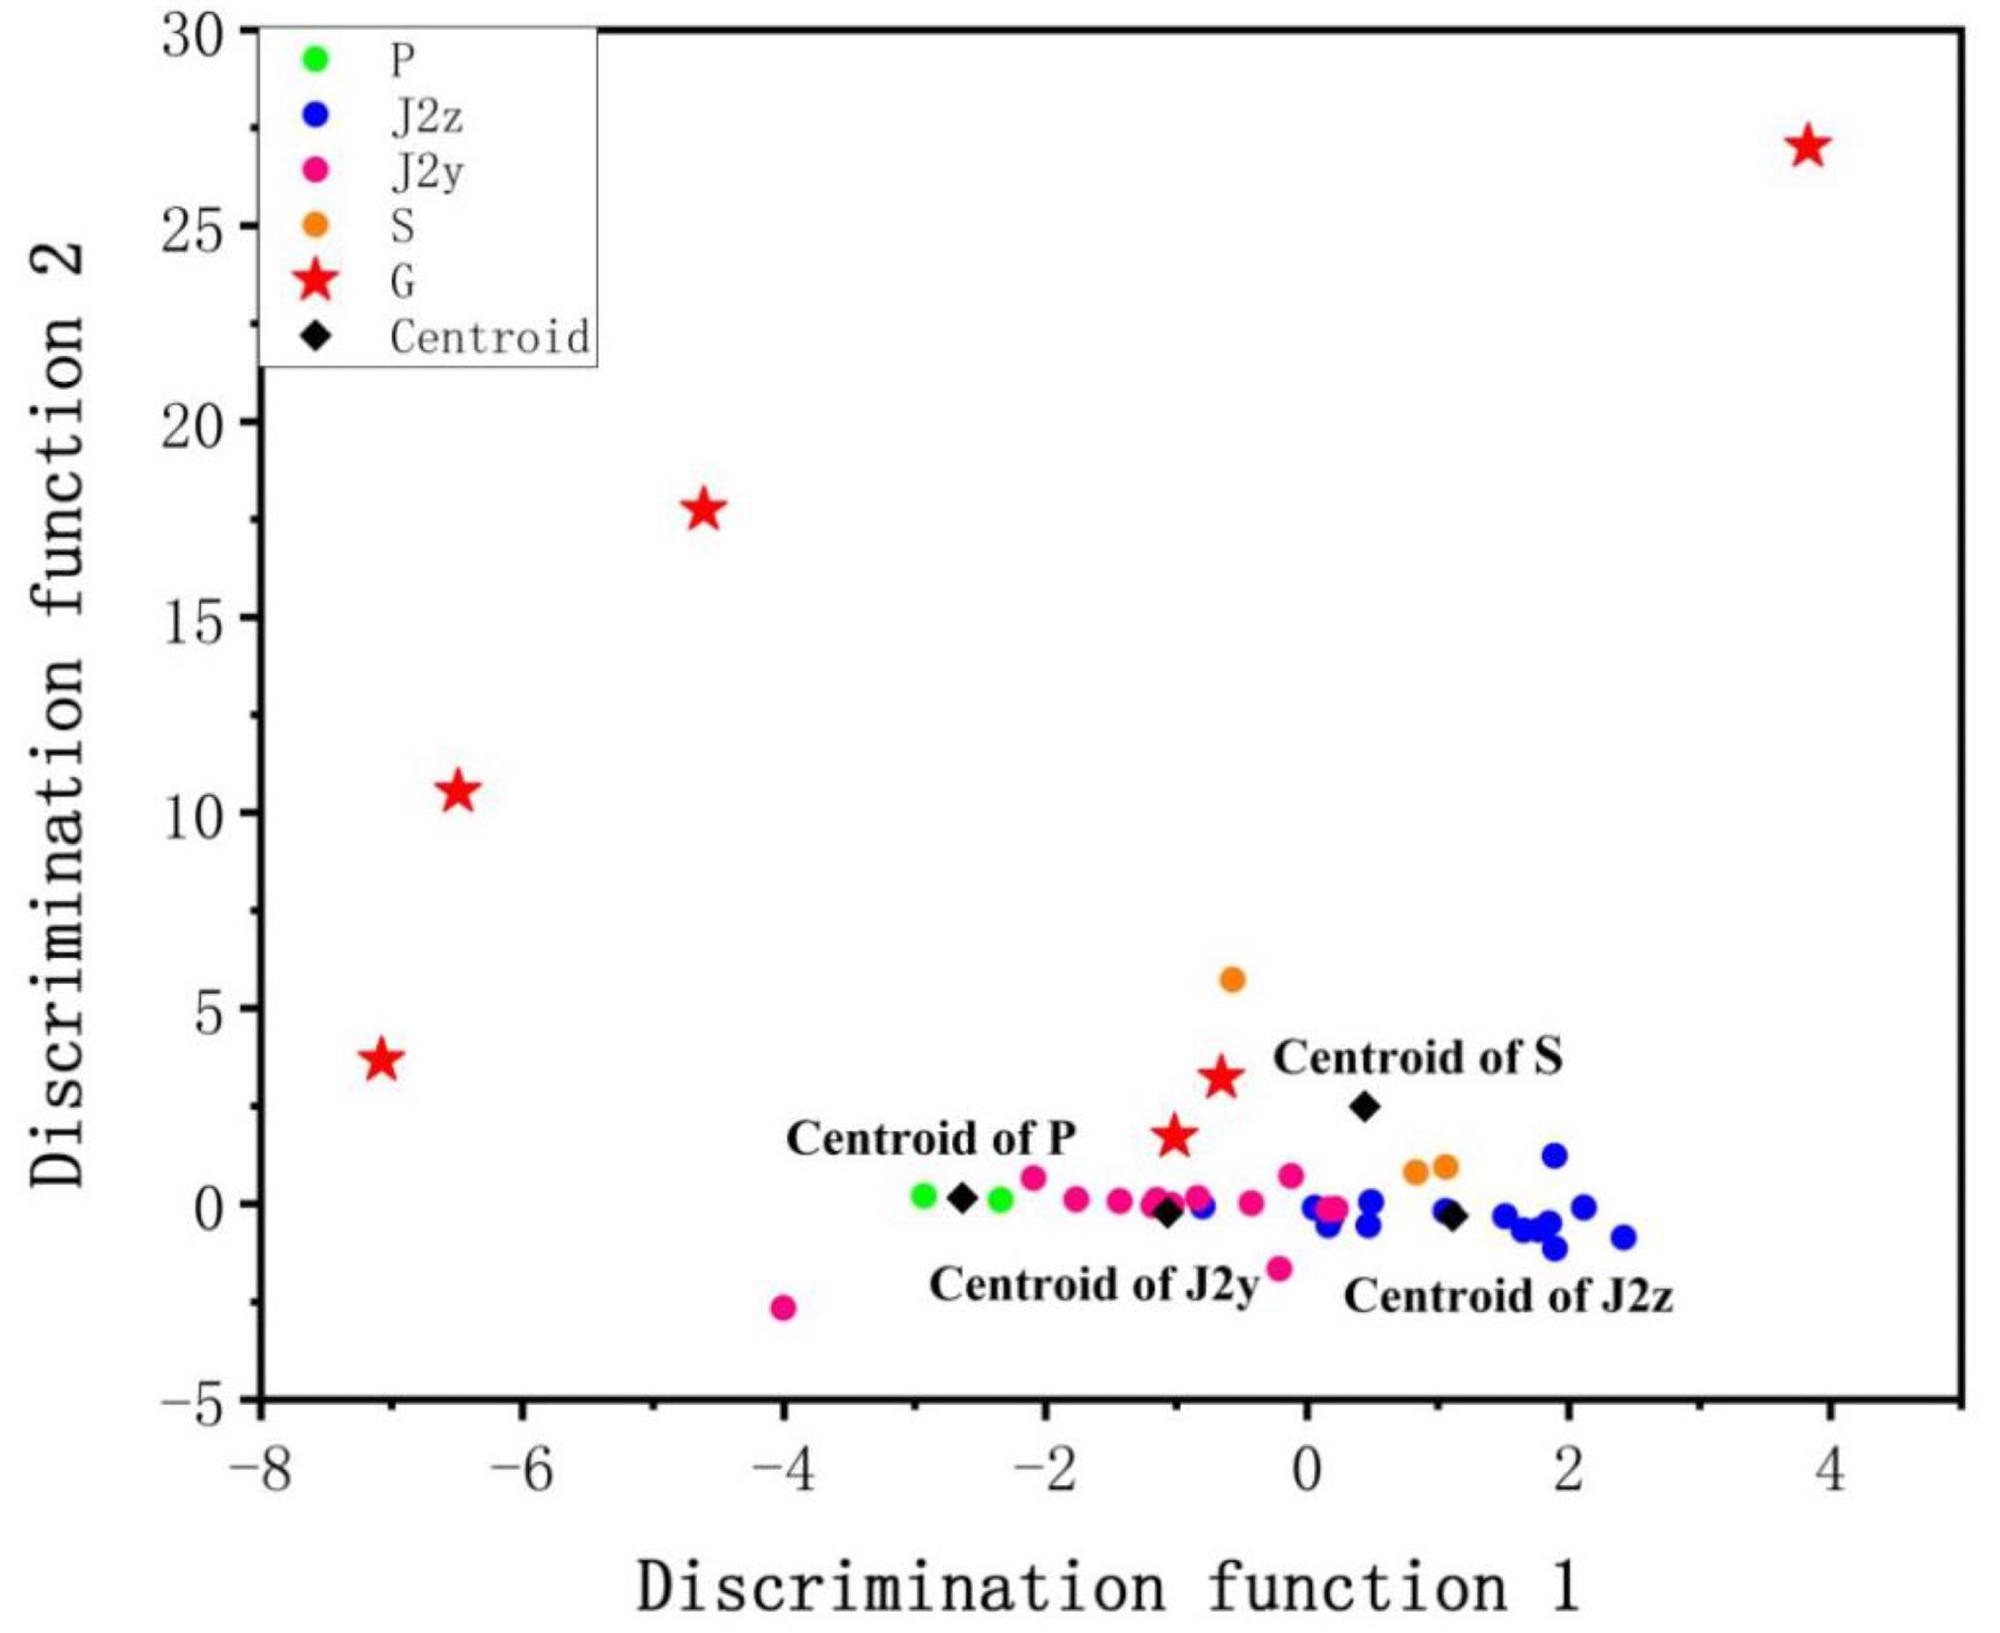
Figure 7. Spatial distribution of water sample discriminant function. Image Credit: Zhao, et al., 2022
Table 1 shows the distances between gushing water and the centroids of the four water sample types.
Table 1. Distance of gushing water to the centroid. Source: Zhao, et al., 2022
| Gushing Water |
Distance to the Centroid of P |
Distance to the Centroid of J2z |
Distance to the Centroid of J2y |
Distance to the Centroid of S |
| G1 |
11.074 |
13.244 |
12.042 |
10.618 |
| G2 |
2.253 |
2.937 |
1.934 |
1.648 |
| G3 |
17.700 |
18.937 |
18.306 |
16.066 |
| G4 |
5.665 |
9.105 |
7.157 |
7.609 |
| G5 |
27.634 |
27.463 |
27.674 |
24.761 |
| G6 |
3.645 |
3.941 |
3.455 |
1.313 |
Discussion
The self-organizing feature map was developed as a simple and rapid way of identifying water sources in this study.
SOM determined that the sources of G1, G2, G3, G4, G5, and G6 were all surface water based on the above investigation. The hydrogeochemical approaches yielded the same results. Because the distance between aquifers, external interference, and the number of samples all had a substantial impact on water temperature, this can only be used as an auxiliary identification approach.
The gushing water sample G4 was recognized as Quaternary pore water by using FDA. G4 and G2 were quite close in terms of hydrogeological features, and the two-sample stations were in the same aquifer. In the result, surface water was determined to be the source of all the mine gushing water samples.
Conclusion
To define the hydrogeochemical features of mine gushing water in Ningtiaota Coal Mine, 11 indicators, comprising pH, TDS, T, and the principal ions, were determined in 40 water samples by field studies and experimental testing.
A self-organizing feature map was used in this study to determine the source of mine gushing water. The hydrogeochemical features of water samples G1–G6 were compared to those of the surface-water cluster, and they were recognized as surface water. As supplementary measurements, FDA, water temperature, and classic hydrogeochemical discrimination, such as Piper and Gibbs diagrams, were used to confirm the SOM analysis.
The SOM method offers significant advantages in terms of data visualization, dimensionality reduction, and grouping, and it is particularly well suited to source analysis with large training samples. It may be used to not only measure a source but also to assess the hydrogeochemical features of a sample at the same time.
As a consequence of the reduction of human influence in sample sets, the findings of source classification of mine gushing water have high efficiency and precision. In conclusion, this study establishes a scientific foundation for mine-water hazard prediction as well as water source anticipation and control. It offers theoretical support as well as a practical foundation for policy formation and the prevention of mine-water hazards.
Journal Reference:
Zhao, D., Zeng, Y., Wu, Q., Du, X., Gao, S., Mei, A., Zhao, H., Zhang, Z. and Zhang, X. (2022) Source Discrimination of Mine Gushing Water Using Self-Organizing Feature Maps: A Case Study in Ningtiaota Coal Mine, Shaanxi, China. Sustainability, 14(11), p.6551. Available Online: https://www.mdpi.com/2071-1050/14/11/6551/htm.
References and Further Reading
- Huang, X. J., et al. (2018) Hydrochemical and Stable Isotope (δD and δ18O) Characteristics of Groundwater and Hydrogeochemical Processes in the Ningtiaota Coalfield, Northwest China. Mine Water and the Environment, 37, pp. 119–136. doi.org/10.1007/s10230-017-0477-x.
- Xie, P., et al. (2018) Hydrogeological Model for Groundwater Prediction in the Shennan Mining Area, China. Mine Water and the Environment, 37, pp. 505–517. doi.org/10.1007/s10230-017-0490-0.
- Hou, E. K., et al. (2019) Study on recognition of mine water sources based on statistical analysis. Arabian Journal of Geosciences, 13, p. 5. doi.org/10.1007/s12517-019-4984-x.
- Liu, Z. B., et al. (2020) Scanning for water hazard threats with sequential water releasing tests in underground coal mines. Journal of Hydrology, 590, p. 125350. doi.org/10.1016/j.jhydrol.2020.125350.
- Wu, Q., et al. (2017) Method for assessing coal-floor water-inrush risk based on the variable-weight model and unascertained measure theory. Hydrogeology Journal, 25, pp. 2089–2103. doi.org/10.1007/s10040-017-1614-0.
- Zeng, Y. F., et al. (2016) Vulnerability assessment of waterbursting from Ordovician limestone into coal mines of China. Environmental Earth Sciences, 75, p. 1431. doi.org/10.1007/s12665-016-6239-4.
- Zeng, Y. F., et al. (2017) Evaluation of a coal seam roof water inrush: Case study in the Wangjialing coal mine, China. Mine Water and the Environment, 37, pp. 174–184. doi.org/10.1007/s10230-017-0459-z.
- Wu, Q., et al. (2000) Three maps-two predictions method to evaluate water bursting conditions on roof coal. Journal of China Coal Society, 125, pp. 60–65. doi.org/10.13225/j.cnki.jccs.2000.01.014.
- Wu, Q., et al. (2007) A new practical methodology of the coal floor water bursting evaluating Ⅱ: The vulnerable index method. Journal of China Coal Society, 132, pp. 1121–1126.
- Wu, Q., et al. (2011) Water-richness evaluation method of water-filled aquifer based on the principle of information fusion with GIS: Water-richness index method. Journal of China Coal Society, 136, pp. 1124–1128. doi.org/10.13225/j.cnki.jccs.2011.07.002.
- Liu, H & Cao, Y (2011) Technologies of Preventing Coal Mine Water Hazards for Sustainable Development in North China. Geotechnical and Geological Engineering, 29, pp. 1–5. doi.org/10.1007/s10706-010-9361-1.
- Li, X. B., et al. (2013) Determination of the minimum thickness of crown pillar for safe exploitation of a subsea gold mine based on numerical modeling. International Journal of Rock Mechanics and Mining Sciences, 57, pp. 42–56. doi.org/10.1016/j.ijrmms.2012.08.005.
- Wu, Q., et al. (2016) The progress of the mine water prevention and control on basic principles in China. Annual Meeting International Mine Water Association, pp. 122–126. (In Chinese)
- Yang, W. F., et al. (2016) The fuzzy comprehensive evaluation of water and sand inrush risk during underground mining. Journal of Intelligent & Fuzzy Systems, 30, pp. 2289–2295. https://doi.org/10.3233/IFS-151998
- Chen, Y., et al. (2021) Analysis of hydrochemical evolution in main discharge aquifers under mining disturbance and water source identification. Environmental Science and Pollution Research, 28, pp. 26784–26793. doi.org/10.1007/s11356-021-12639-w.
- Sakizadeh, M., et al. (2016) Geochemical influences on the quality of groundwater in eastern part of Semnan Province, Iran. Environmental Earth Sciences, 75, p. 917. doi.org/10.1007/s12665-016-5722-2.
- Li, Y. P., et al. (2018) Water source identification of the drained-produced horizons for the coalbed methane well based on support vector machine. Petroleum Geology & Oilfield Development in Daqing, 37, pp. 171–174.
- Dong, D. L., et al. (2019) Combining the Fisher Feature Extraction and Support Vector Machine Methods to Identify the Water Inrush Source: A Case Study of the Wuhai Mining Area. Mine Water and the Environment, 38, pp. 855–862. doi.org/10.1007/s10230-019-00637-x.
- Mao, Z. Y., et al. (2021) KPCA-CS-SVM discrimination model of mine water inrush source. Journal Liaoning Technical University, 40, pp. 104–111.
- Zhang, H., et al. (2019) The multiple logistic regression recognition model for mine water inrush source based on cluster analysis. Environmental Earth Sciences, 78, p. 612. doi.org/10.1007/s12665-019-8624-2.
- Duan, X. L., et al. (2022) Identification of Mine Water Sources Based on the Spatial and Chemical Characteristics of Bedrock Brines: A Case Study of the Xinli Gold Mine. Mine Water Environment, 41, pp. 126–142. doi.org/10.1007/s10230-021-00810-1.
- Jiang, C. L., et al. (2021) Water Source Discrimination in a Multiaquifer Mine Using a Comprehensive Stepwise Discriminant Method. Mine Water Environment, 40, pp. 442–455. doi.org/10.1007/s10230-020-00742-2.
- Hao, Q., et al. (2020) Groundwater source determination of mine inflow or inrush using a random forest model. Engineering Science and Technology, 20, pp. 6411–6418.
- Bouzourra, H., et al. (2015) Characterization of mechanisms and processes of groundwater salinization in irrigated coastal area using statistics, Gis, and hydrogeochemical investigations. Environmental Science and Pollution Research, 22, pp. 2643–2660. doi.org/10.1007/s11356-014-3428-0.
- Najib, S., et al. (2017) Conntribution of hydrochemical and geoelectrical approaches to investigate salinization process and seawater intrusion in the coastal aquifers of Chaouia, Morocco. Journal of Contaminant Hydrology, 198, pp. 24–36. doi.org/10.1016/j.jconhyd.2017.01.003.
- Kuroda, K., et al. (2017) Groundwater recharge in suburban areas of Hanoi, Vietnam: Effect of decreasing surface water bodies and land-use change. Hydrogeol Journal, 25, pp. 727–742. doi.org/10.1007/s10040-016-1528-2.
- Xu, Z. M., et al. (2018) Groundwater Source Discrimination and Proportion Determination of Mine Inflow Using Ion Analyses: A Case Study from the Longmen Coal Mine, Henan Province, China. Mine Water Environment, 37, pp. 385–392. doi.org/10.1007/s10230-018-0512-6.
- Petitta, M., et al. (2011) Interaction between deep and shallow groundwater systems in areas affected by Quatemary tectonics (Central Italy): A geochemical and isotope approach. Environment Earth Sciences, 63, pp. 11–30. doi.org/10.1007/s12665-010-0663-7.
- Mauryaa, P., et al. (2019) Hydrochemistry in integration with stable isotopes (δ18O and δD) to assess seawater intrusion in coastal aquifers of Kachchh district, Gujarat, India. Journal of Geochemical Exploration, 196, pp. 42–56. doi.org/10.1016/j.gexplo.2018.09.013.
- Potot, C., et al. (2012) Groundwater and river baselinequality using major, trace elements, organic carbon and Sr–Pb–Oisotopes in a Mediterranean catchment: The case of the lower VarValley (south-eastern France). Journal of Hydrology, 472, pp. 126–147. doi.org/10.1016/j.jhydrol.2012.09.023.
- Wu, Q., et al. (2019) Source discrimination of mine water inrush using multiple methods: A case study from the Beiyangzhuang Mine, Northern China. Bulletin of Engineering Geology and the Environment, 78, pp. 469–482. doi.org/10.1007/s10064-017-1194-1.
- Ma, L., et al. (2014) An approach for quickly identifying water-inrush source of mine based on GIS and groundwater chemistry and temperature. Coal Geology & Exploration, 42, pp. 49–53. doi.org/10.3969/j.issn.1001-1986.2014.02.010.
- Yan, P. C., et al. (2016) Research on the Source Identification of Mine Water Inrush Based on LIF Technology and SIMCA Algorithm. Spectroscopy Spectra Analytical, 36, pp. 243–247.
- Wu, Y L (2017) Mining-Induced Environmental Engineering Geological Pattern Zoning in Yushen Coal Mining Area, Northern Shaanxi; China University of Mining & Technology: Beijing, China.
- Kohonen, T (1982) Self-organized formation of topologically correct feature maps. Biological Cybernetics, 43, pp. 59–69. doi.org/10.1007/BF00337288.
- Kohonen, T., et al. (1997) Self-Organizing Maps; Springer: Berlin/Heidelberg, Germany. doi.org/10.1109/ICNN.1997.611622.
- Zhu, G (2018) Characteristics of Groundwater Environment and Heavy Metals Transport in a Typical Metal Mine in Tongling, Anhui Province; China University of Geosciences: Beijing, China.
- Baghanam, A. H., et al. (2020) Spatiotemporal variation of water pollution near landfill site: Application of clustering methods to assess the admissibility of LWPI. Journal Hydrology, 591, p. 125581. doi.org/10.1016/j.jhydrol.2020.125581.
- Cereghino, R & Park, Y S (2009) Review of the Self-Organizing Map (SOM) approach in water resources: Commentary. Environmental Modelling & Software, 24, pp. 945–947. doi.org/10.1016/j.envsoft.2009.01.008.
- Wu, C., et al. (2020) Hydrogeochemical characterization and quality assessment of groundwater using self-organizing maps in the Hangjinqi gasfield area, Ordos Basin, NW China. Geoscience Frontiers, 12, pp. 781–790. doi.org/10.1016/j.gsf.2020.09.012.
- Zhao, W., et al. (2020) Identification of water inrush source based on fisher discriminant method and centroid distance theroy. Engineering Science and Technology, 20, pp. 3552–3556.
- Xiao, Y., et al. (2021) Investigating sources, driving forces and potential health risks of nitrate and fluoride in groundwater of a typical alluvial fan plain. Science of The Total Environment, 802, p. 149909. doi.org/10.1016/j.scitotenv.2021.149909.
- Xiao, Y., et al.( 2022) Hydrogeochemical insights into the signatures, genesis and sustainable perspective of nitrate enriched groundwater in the piedmont of Hutuo watershed, China. Catena, 212, p. 106020. doi.org/10.1016/j.catena.2022.106020.
- Yu, H, et al. (2020) Hydrochemical characteristics and water quality evaluation of shallow groundwater in Suxian mining area, Huaibei coalfield, China. International Journal of Coal Science & Technology, 7, pp. 825–835. doi.org/10.1007/s40789-020-00365-6.
- Zhang, K., et al. (2020) Understanding of mineral change mechanisms in coal mine groundwater reservoir and their influences on effluent water quality: A experimental study. International Journal of Coal Science & Technology, 8, pp. 154–167. doi.org/10.1007/s40789-020-00368-3.
- Lewińska-Preis, L., et al. (2021) Selected ions and major and trace elements as contaminants in coal-waste dump water from the Lower and Upper Silesian Coal Basins (Poland). International Journal of Coal Science & Technology, 8, pp. 790–814. doi.org/10.1007/s40789-021-00421-9.
- Xiao, Y., et al. (2022) Occurrence, Controlling Factors and Health Hazards of Fluoride-Enriched Groundwater in the Lower Flood Plain of Yellow River, Northern China. Exposure Health, 14, pp. 345–358. doi.org/10.1007/s12403-021-00452-2.
- Qiu, H., et al. (2021) Groundwater contamination and human health risk based on Monte Carlo simulation in a typical mining area in Northern Anhui Province, China. International Journal of Coal Science & Technology, 8, pp. 1118–1129. doi.org/10.1007/s40789-021-00446-0.
- Mursito, A. T., et al. (2020) Characterization of bio-coal briquettes blended from low quality coal and biomass waste treated by Garant® bio-activator and its application for fuel combustion. International Journal of Coal Science & Technology, 7, pp. 796–806. doi.org/10.1007/s40789-020-00309-0.
- Sun, K., et al. (2021) Impact of coal mining on groundwater of Luohe Formation in Binchang mining area. International Journal of Coal Science & Technology, 8, pp. 88–102. doi.org/10.1007/s40789-020-00366-5.