China’s coal resources have increasingly progressed into the deep stratum, a more difficult geomechanical environment than shallow resources. Rock mass tragedies are common, and infrared technology is being investigated as a possible way of detecting rock mass instability. In a paper published in Sustainability, a study team used a multi-fractal theory to describe the infrared thermal image properties of the rock loading process.
Image Credit: Jaromir Chalabala/Shutterstock.com
Non-destructive, non-contact, and observable are properties of infrared technology. It is also frequently employed and researched in a variety of rock engineering sectors, including road excavation and landslides.
During the rock loading process, a significant number of academics have investigated the properties of infrared radiation temperature (IRT) and infrared thermal imaging. However, most explanations of IRT and infrared thermal images are qualitative, which makes it difficult to apply such technology to engineering in the future.
Variance, entropy, feature roughness, and b-value have been utilized by certain studies to quantitatively characterize infrared thermal pictures of rock mass instability, but the multi-fractal theory can be employed to evaluate sophisticated infrared thermal images.
Methodology
Standard samples of Φ 50 mm×100 mm were produced to perform the uniaxial compression testing in accordance with ISRM requirements. The samples were produced of red sandstone from Shanxi Province’s Linfen mining region. The rock used has a density of 2454.65 kg/m3.
The P-wave velocity of the samples was examined to determine that they were homogeneous. The wave velocities of all samples are around 3.51 km/s, and sample homogeneity is acceptable.
A loading mechanism and an infrared thermal imager make up the test system. The infrared thermal imager is an Optris PI450 high-resolution infrared thermal imager, and the loading system is a SANS microcomputer-controlled electro-hydraulic servo pressure testing equipment.
The optical resolution is 288 × 382 pixels, the temperature measurement range is −20~100 °C, the spectral range is 7.5~13 μm, the frame rate is 80 Hz, the field-of-view angle is 30° × 23°, and the thermal sensitivity is 0.04 k.
The infrared thermal imager was placed 50 cm away from the specimen and the capture rate for infrared thermal images was set at 10 Hz. The infrared thermal imager was preheated for around 30 minutes before the test, and loading began after the imager was steady.
The loading speed was set at 400 N/s. After the loading was finished, the force, displacement, and IRR data were all collected and saved at the same time. The test was completed when the sandstone failed.
Any item with a temperature greater than absolute zero (−273.15 °C) generates electromagnetic radiation in the form of waves with a very wide wavelength range. The component with a wavelength of 2.5–15 μm has a thermal effect, while IRR is an electromagnetic wave with a wavelength range of 0.7–1000 μm.
An infrared thermal imager collects the IRR wave, which is then transformed into temperature data using the Stefan–Boltzmann formula.
This is illustrated in Figure 1.
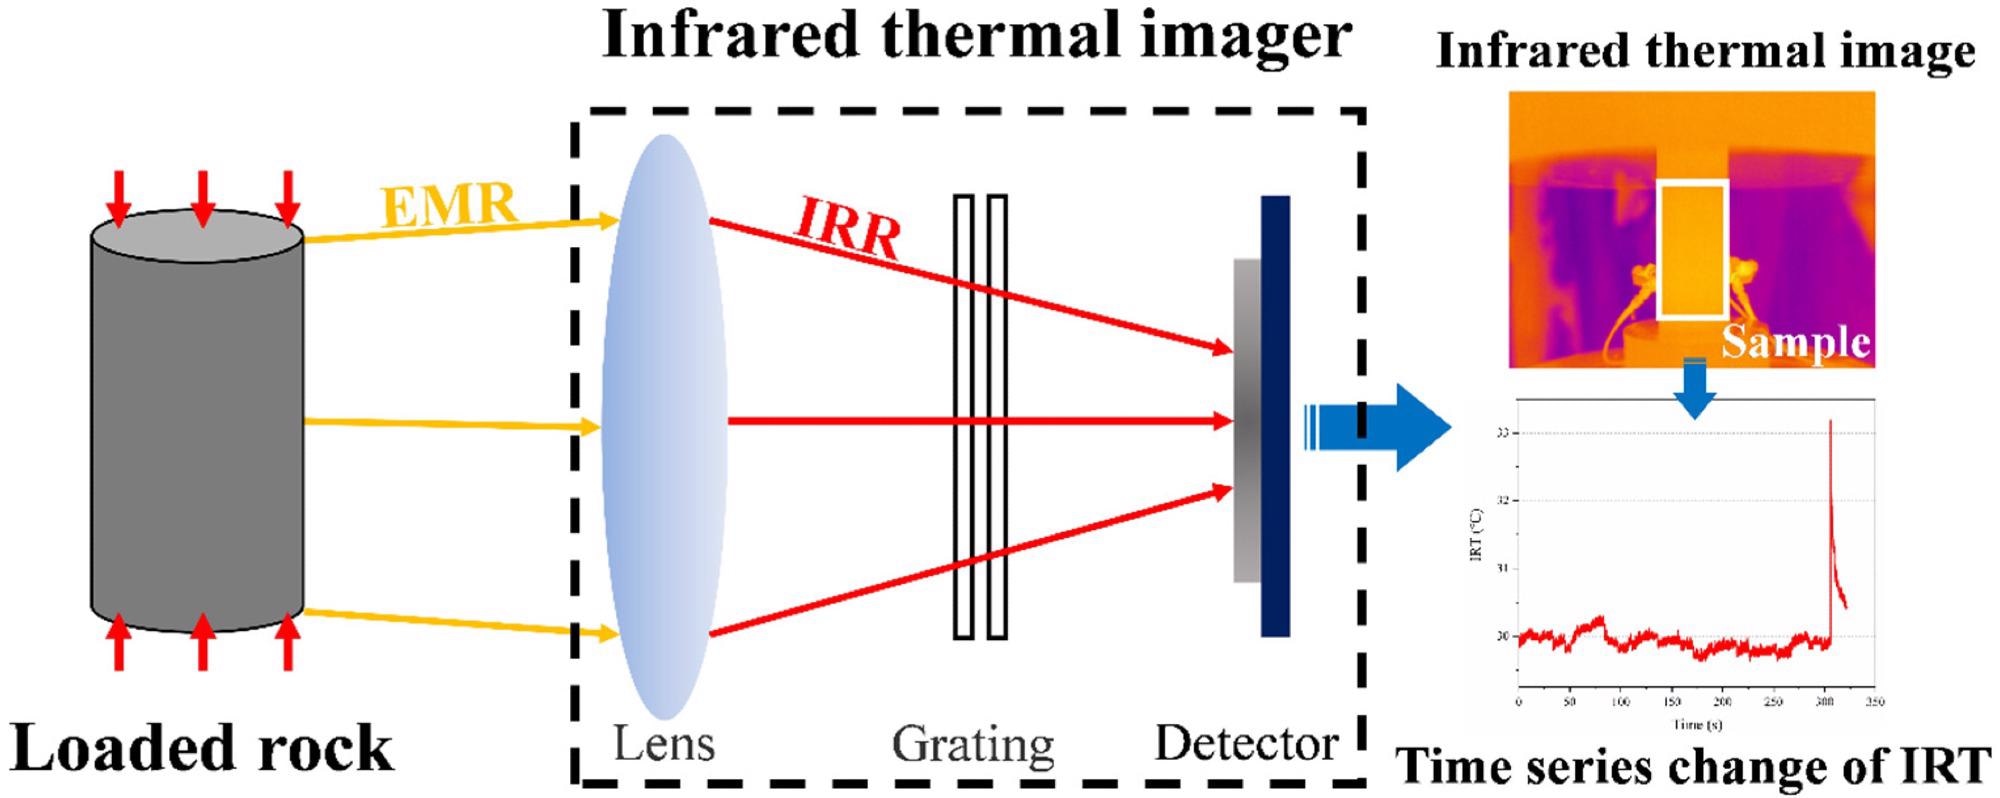
Figure 1. Schematic diagram of infrared technology. Image Credit: Miao, et al., 2022
The actual infrared thermal picture, which is a matrix made up of IRT data, is shown in Figure 2. MATLAB software is used to examine the retrieved IRT matrix. Each pixel correlates to the relevant position’s IRT data.
If the instrument’s optical resolution is 288 × 382 pixels, the output result is an IRT matrix T288×382 with a size of 288 × 382. MATLAB program extracts the IRT matrix xm×n at the sample point (valid area), and the multi-fractal features of the data in the matrix are examined according to the literature.
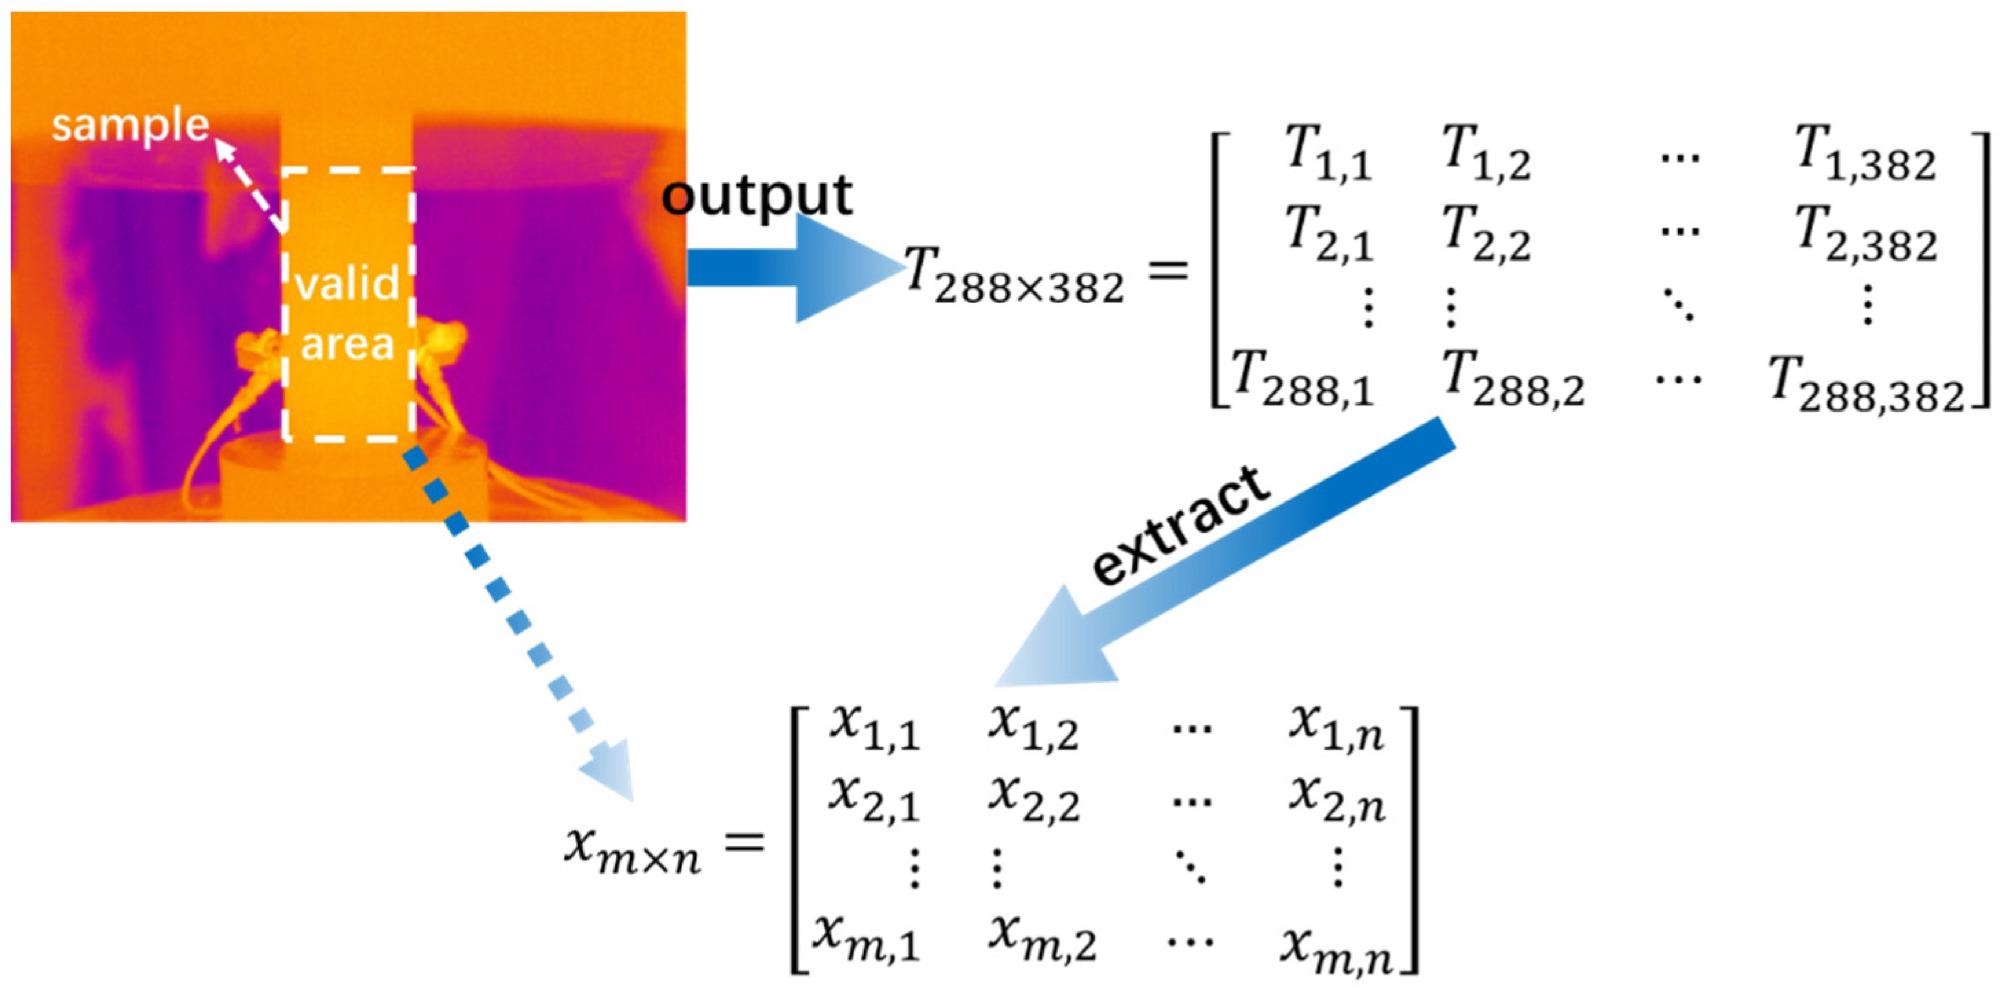
Figure 2. Infrared thermal image data extraction process. Image Credit: Miao, et al., 2022
Results
The numbers S-1 and S-2 represent two typical samples that were used as examples for further examination. Figure 3 depicts the stress and strain on the surface of the two samples during the loading process, as well as changes in MaxIRT, AIRT, and the lowest IRT (MinIRT).
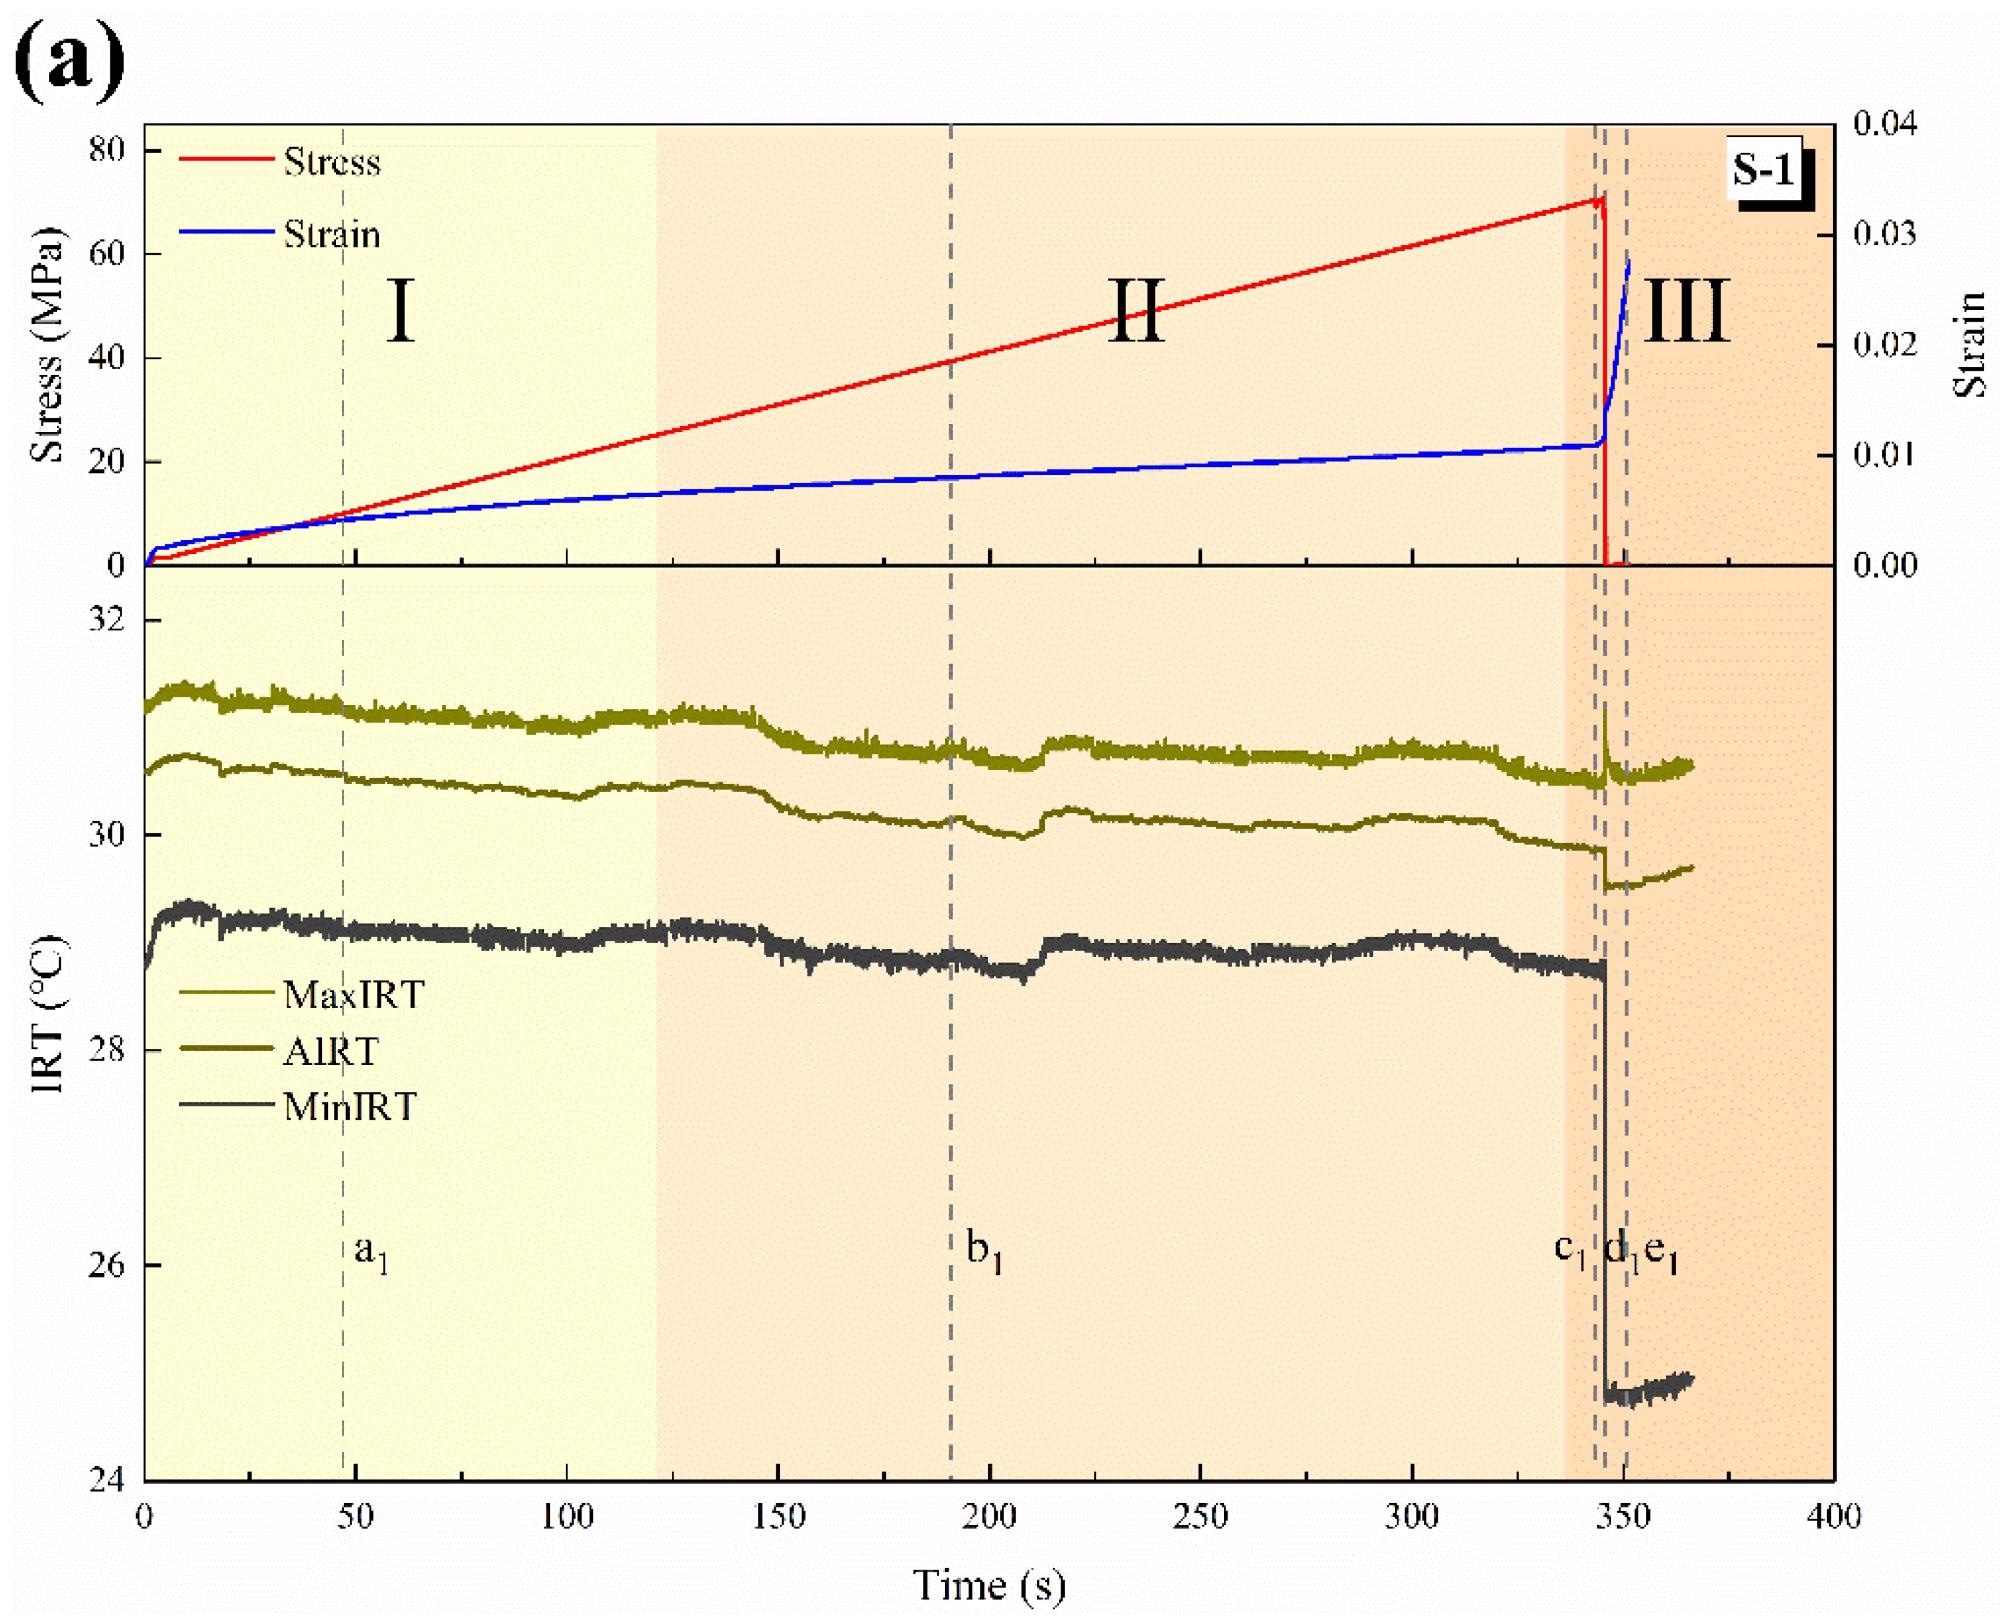
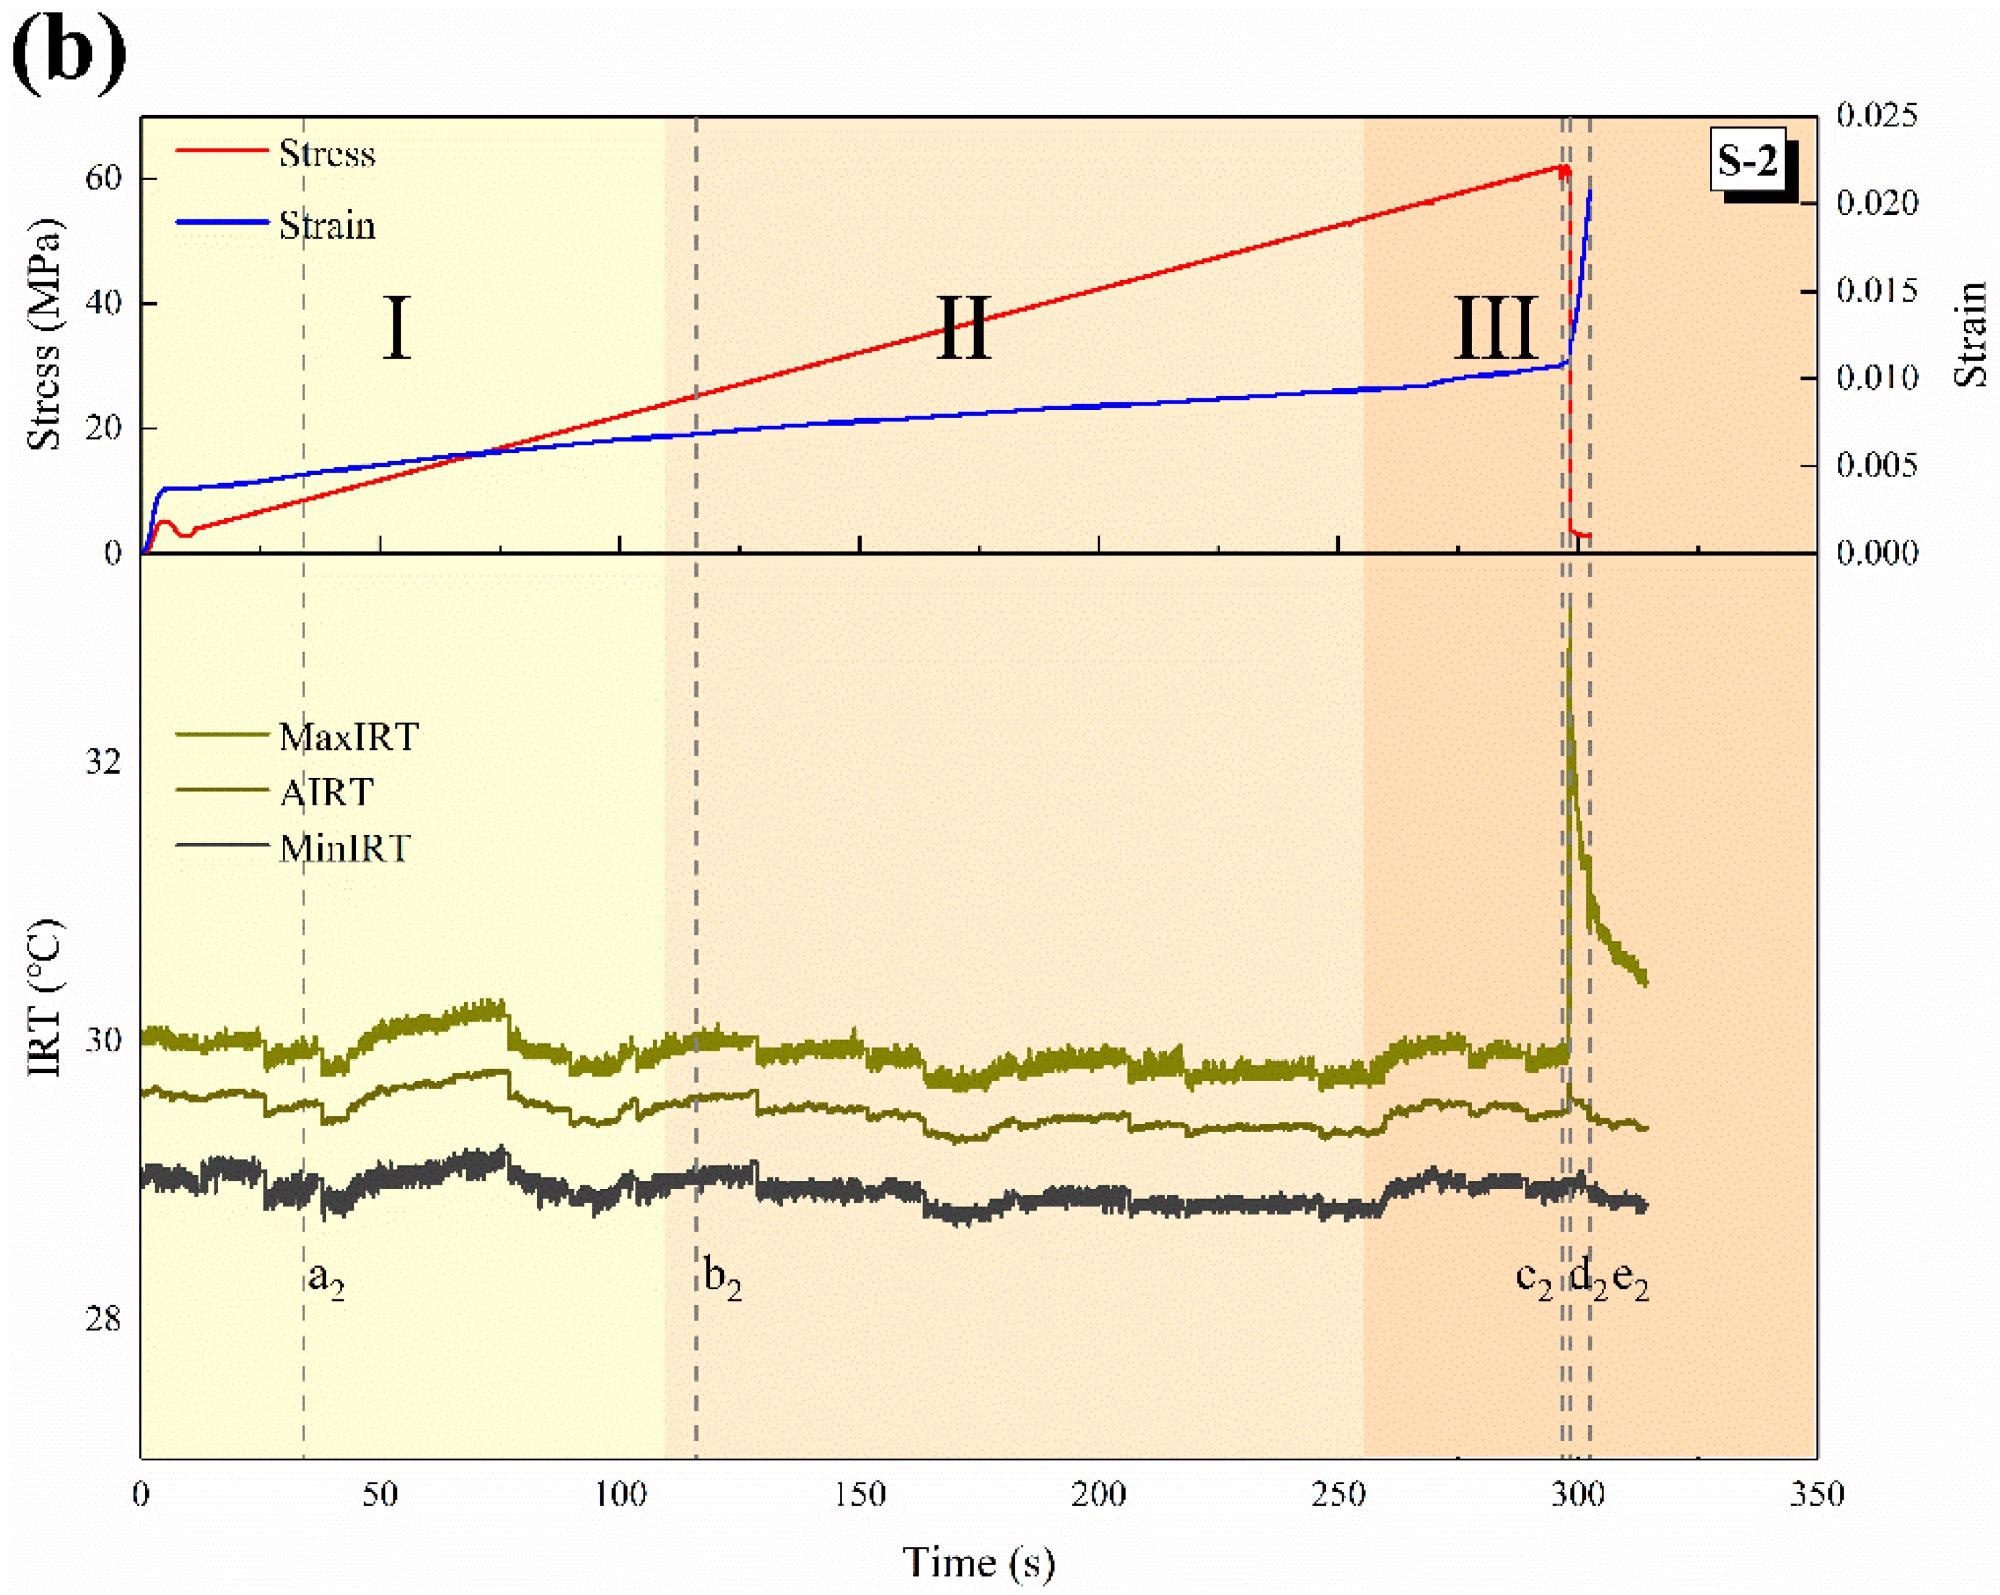
Figure 3. Time series change in IRT: (a) S-1; (b) S-2. (Different color blocks distinguish stage I, II and III). Image Credit: Miao, et al., 2022
Compaction (Stage I), Elastic deformation (Stage II), and Yield and failure (Stage III) are the three stages of the loading process for rock.
The variations in MaxIRT, AIRT, and MinIRT are very synchronous in the initial two stages (Compaction and Elastic deformation) of loading, indicating that the surface temperature changes are uniform and integral. Sample S-1’s initial MaxIRT, AIRT, and MinIRT are around 31.19 °C, 30.58 °C, and 20.8 °C, respectively, and the curves then exhibit a steady drop trend with no variation.
The initial MaxIRT, AIRT, and MinIRT of sample S-2 are approximately 30.04 °C, 29.63 °C, and 29.02 °C, respectively, and the curves are then slightly inflected but essentially unaltered.
In most trials, the IRT of the rock increases during the loading process, although it occasionally decreases, which might be due to the exhaust gas after the rock pore has been squeezed.
In stage III, the infrared temperature fields show local aberrant changes in the specimens, with the MaxIRT increasing while the AIRT decreases and the MinIRT remaining essentially unaltered.
Two infrared thermal photos of two samples were chosen at various times (a1-e1, a2-e2). The above-shown Figure 3 depicts the locations of several time points, where the multi-fractal features of IRT field data were determined. The results of sample S-1’s calculations are shown in Figures 4 and 5a.
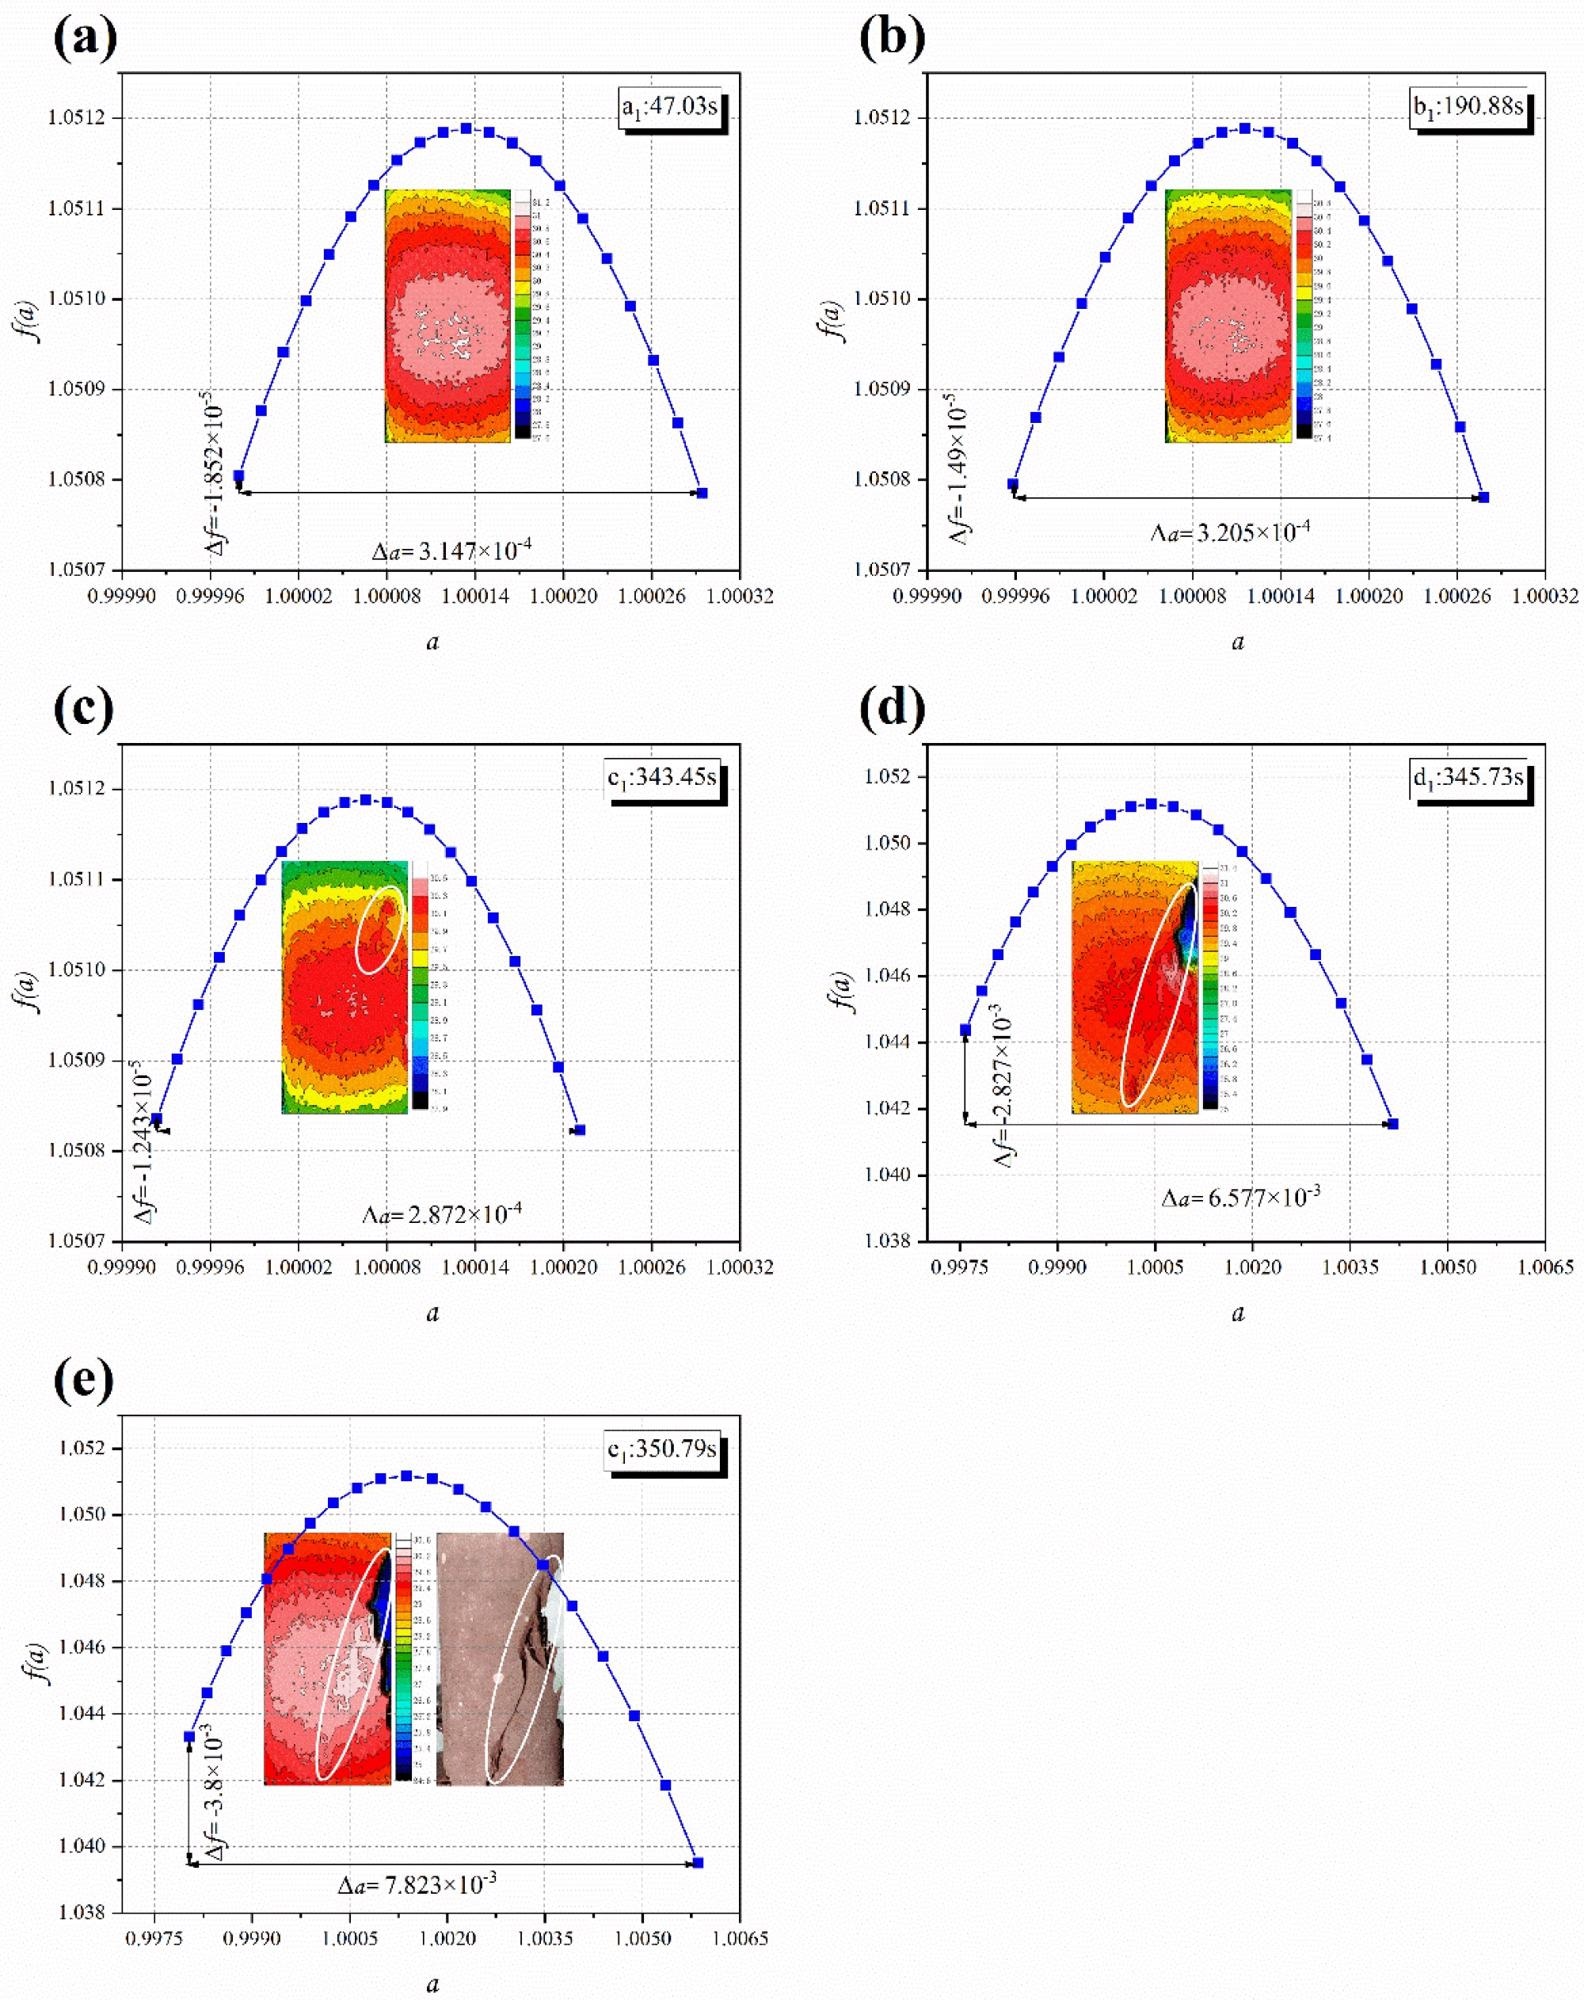
Figure 4. Multi-fractal features of infrared thermal images at different time points of S-1: (a) a1; (b) b1; (c) c1; (d) d1; (e) e1. Image Credit: Miao, et al., 2022
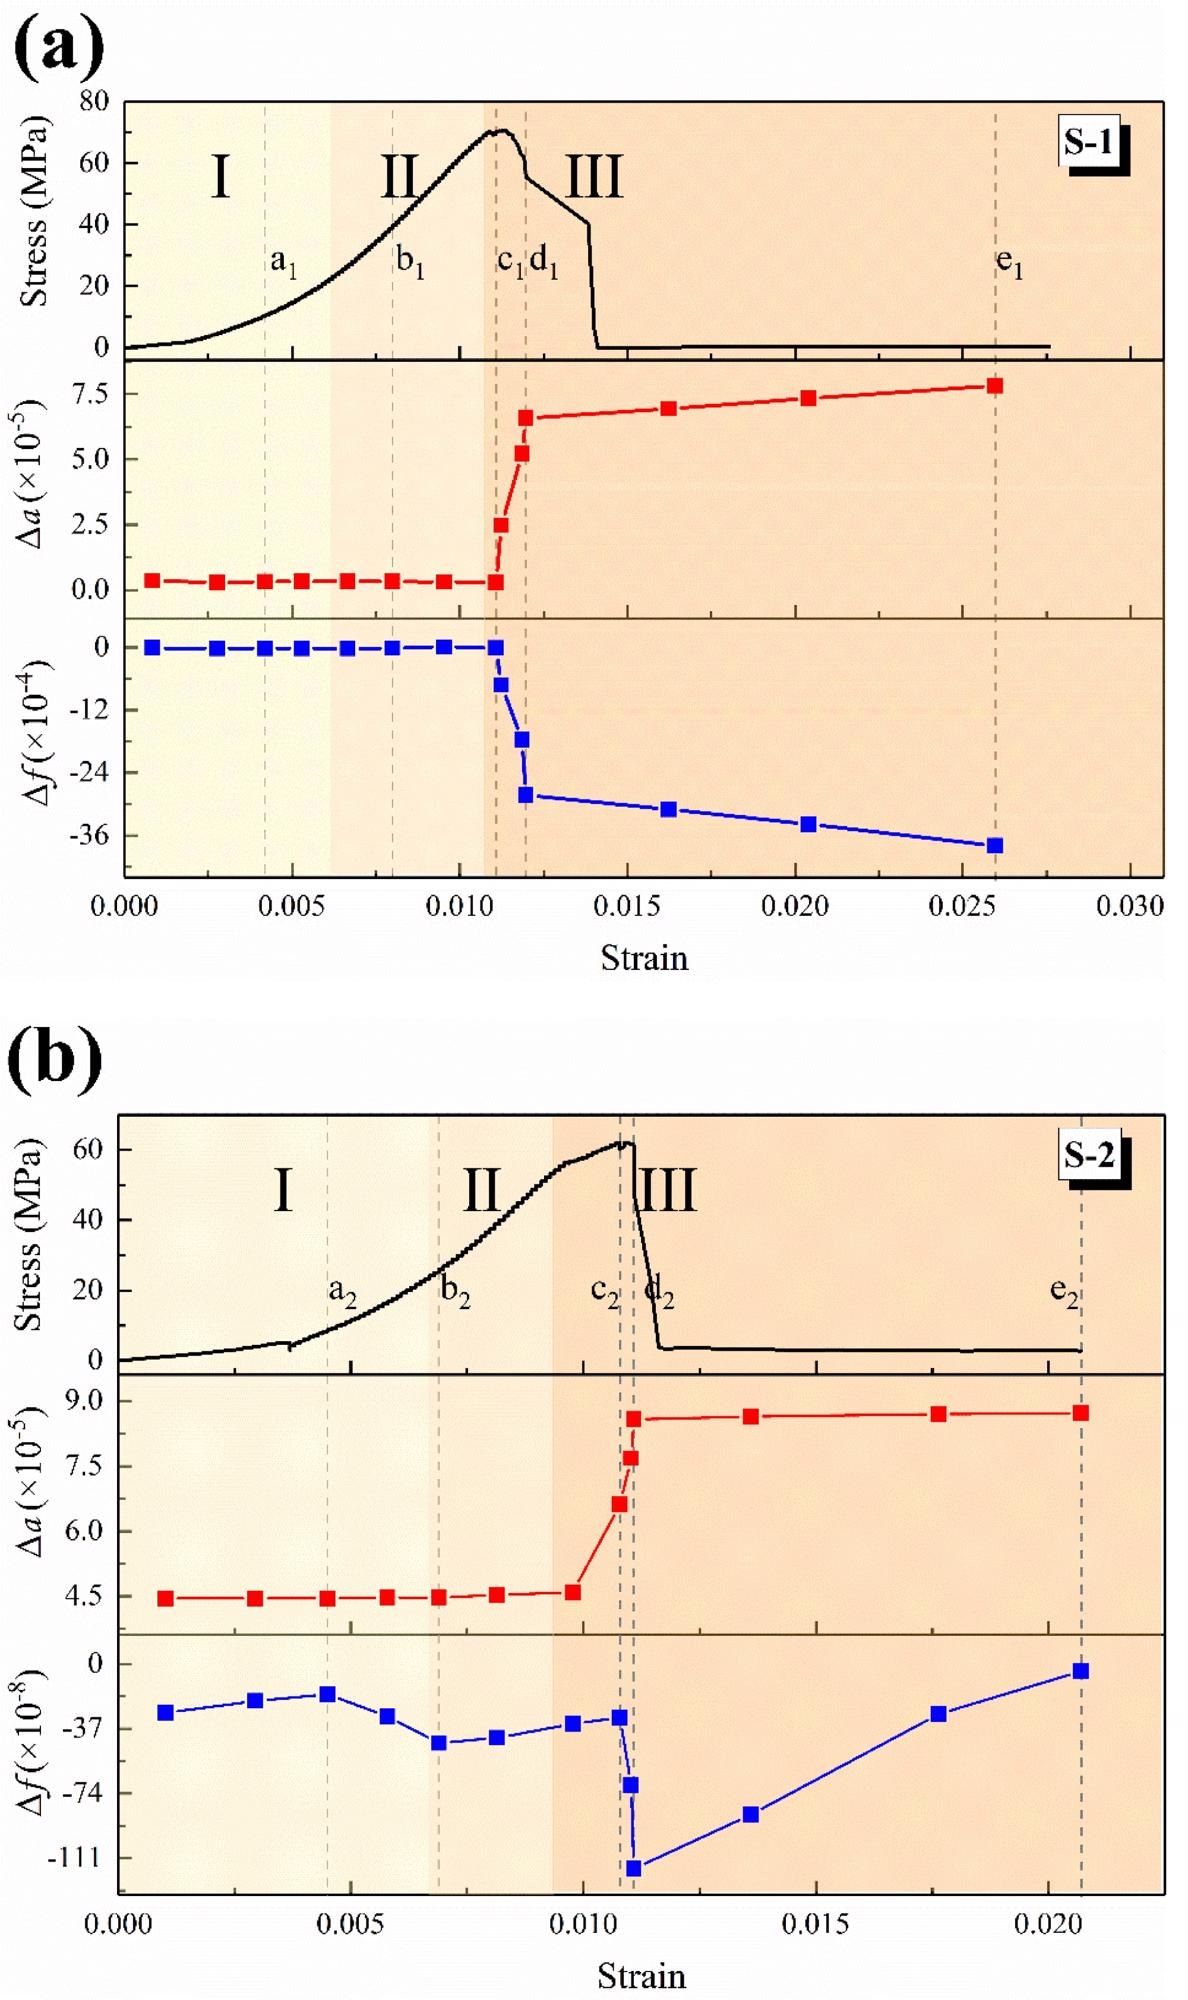
Figure 5. Dynamic changes of multi-fractal indicators of infrared thermal image: (a) S-1; (b) S-2. (Different color blocks distinguish stage I, II and III). Image Credit: Miao, et al., 2022
The results of sample S-2’s calculations are shown in Figures 5b and 6. The sample experiences local shear failure, and the changing trend of Δ α and Δ f is identical to that of sample S-1.
During the failure of the sample, however, the rise in Δ α and drop in Δ f are significantly less than in S-1. The cause for this might be that certain rocks are sliding off, increasing the difference in S-1’s infrared temperature field distribution.
Sample S-1 has a wider shear fracture area than sample S-2, hence the high-temperature data performance is superior.
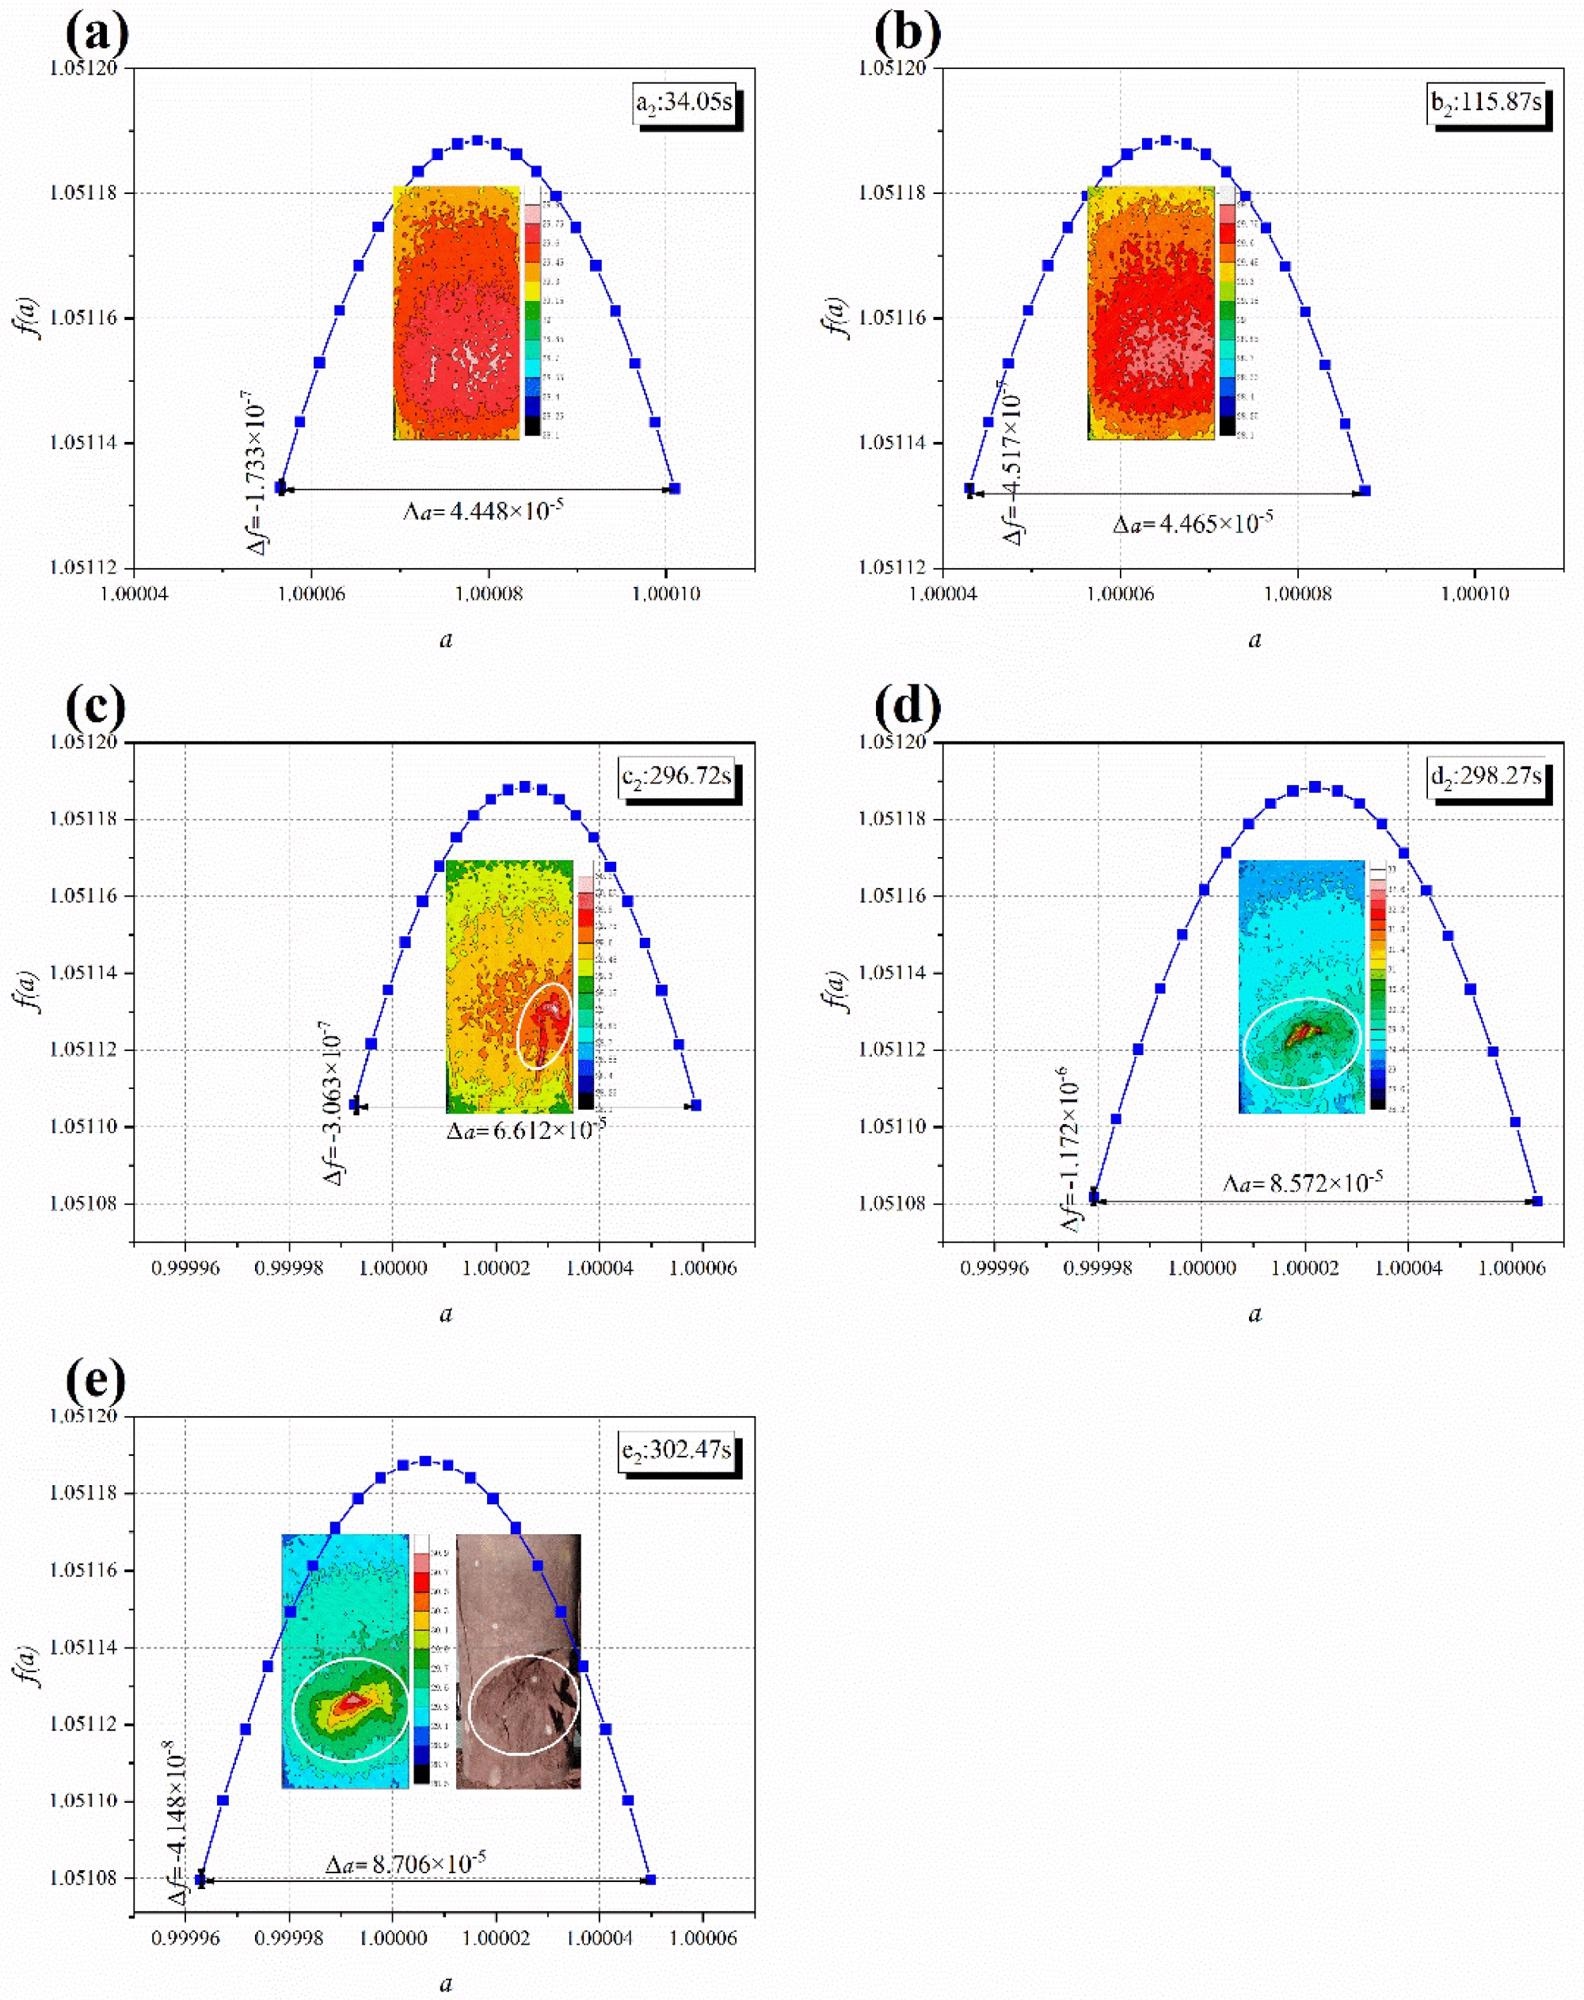
Figure 6. Multi-fractal features of infrared thermal images at different time points of S-2: (a) a2; (b) b2; (c) c2; (d) d2; (e) e2. Image Credit: Miao, et al., 2022
In general, Δ α and Δ f are quite sensitive to the rock’s macroscopic fracture. The IRT of the sample surface varies consistently during the loading process, Δ α and Δ f are almost unchanged.
The macro-fracture of the sample results in changes to Δ α and Δ f when the sample enters the yield and failure stage. This demonstrates the indicators’ reliability. The abrupt shift in Δ α and Δ f might be utilized as a warning sign of impending rock hazards.
The differences in multi-fractal indicators are directly connected to the rock’s collapse mechanism. The greater the high-temperature data performance, the more severe the shear fracture.
Conclusions
The infrared radiation is measured while a uniaxial compression experiment of sandstone is carried out in this paper. To evaluate infrared thermal pictures, the multi-fractal theory was introduced.
Multi-fractal properties can be seen in the infrared thermal picture of rock while loading. The multi-fractal parameters Δ α (temperature non-uniformity) and Δ f (frequency variety of lowest and maximum temperature) are not responsive to changes in the infrared thermal picture during the early stages of loading, but are more sensitive to rock macrofracture.
The samples exhibit an unmistakable reaction when they yield and fail in the latter stages of loading.
The initial findings suggest that multi-fractal analysis of infrared thermal pictures can be used as a reference for monitoring and early warning indications of rock mass catastrophes, which has a wide range of applications. The team wants to develop a stronger connection between multi-fractal markers and rock fracture in the future.
Journal Reference:
Miao, B, Wang, X. and Li, H. (2022) Quantitative Analysis of Infrared Thermal Images in Rock Fractures Based on Multi-Fractal Theory. Sustainability. 14(11), 6543 Available Online: https://www.mdpi.com/2071-1050/14/11/6543/htm
References and Further Reading
- Ortlepp, W D & Stacey, T R (1994) Rockburst mechanisms in tunnels and shafts. Tunnelling and Underground Space Technology, 9, pp. 59–65. doi.org/10.1016/0886-7798(94)90010-8.
- He, M C., et al. (2018) Rockburst mechanism research and its control. International Journal of Mining Science and Technology, 28, pp. 829–837. doi.org/10.1016/j.ijmst.2018.09.002.
- Feng, X. J., et al. (2022) “Double Peak” of dynamic strengths and acoustic emission responses of coal masses under dynamic loading. Natural Resources Research, 31, pp. 1705–1720. doi.org/10.1007/s11053-022-10066-3.
- Feng, X. J., et al. (2022) Orthogonal numerical analysis of deformation and failure characteristics of deep roadway in coal mines: A case study. Minerals, 12, p. 185. doi.org/10.3390/min12020185.
- Li, H. R., et al. (2021) Effect of water on mechanical behavior and acoustic emission response of sandstone during loading process: Phenomenon and mechanism. Engineering Geology, 294, p. 106386. doi.org/10.1016/j.enggeo.2021.106386.
- Li, H., et al. (2020) Effect of water on the time-frequency characteristics of electromagnetic radiation during sandstone deformation and fracturing. Engineering Geology, 265, p. 105451. doi.org/10.1016/j.enggeo.2019.105451.
- Li, H. R., et al. (2022) Electromagnetic radiation signal monitoring and multi-fractal analysis during uniaxial compression of water-bearing sandstone. Measurement, 196, p. 111245. doi.org/10.1016/j.measurement.2022.111245.
- Shen, R., et al. (2020) Infrared radiation characteristics and fracture precursor information extraction of loaded sandstone samples with varying moisture contents. International Journal of Rock Mechanics and Mining Sciences, 130, p. 104344. doi.org/10.1016/j.ijrmms.2020.104344.
- Khan, N. M., et al. (2022) Infrared radiation characteristics based rock failure indicator index for acidic mudstone under uniaxial loading. Arabian Journal of Geosciences, 15, p. 343. doi.org/10.1007/s12517-022-09599-x.
- Cao, K. W., et al. (2022) Statistical damage model for dry and saturated rock under uniaxial loading based on infrared radiation for possible stress prediction. Engineering Fracture Mechanics, 260, p. 108134. doi.org/10.1016/j.engfracmech.2021.108134.
- Tian, H., et al. (2021) Identification method of infrared radiation precursor information of coal sample failure and instability under uniaxial compression. Infrared Physics & Technology, 119, p. 103957. doi.org/10.1016/j.infrared.2021.103957.
- Luong, M P (1990) Infrared thermovision of damage processes in concrete and rock. Engineering Fracture Mechanics, 35, pp. 291–301. doi.org/10.1016/0013-7944(90)90207-W.
- Freund, F.T., et al. (2006) Stimulated infrared emission from rocks: Assessing a stress indicator. Earth, 2, pp. 7–16. doi.org/10.5194/ee-2-7-2007.
- Wang, C. L., et al. (2016) Predicting points of the infrared precursor for limestone failure under uniaxial compression. International Journal of Rock Mechanics and Mining Sciences, 88, pp. 34–43. doi.org/10.1016/j.ijrmms.2016.07.004.
- Gornyi, V. I., et al. (1988) Terrestrial outgoing infrared radiation as an indicator of seismic activity. Proceedings of the Academy of Sciences of the USSR, 301, pp. 67–69. doi.org/10.48550/arXiv.2001.11762.
- Sun, X. M., et al. (2017) Experimental investigation of the occurrence of rockburst in a rock specimen through infrared thermography and acoustic emission. International Journal of Rock Mechanics and Mining Sciences, 93, pp. 250–259. doi.org/10.1016/j.ijrmms.2017.02.005.
- He, M. C., et al. (2010) Physical modeling of an underground roadway excavation in vertically stratified rock using infrared thermography. International Journal of Rock Mechanics and Mining Sciences, 47, pp. 1212–1221. doi.org/10.1016/j.ijrmms.2010.06.020.
- Pappalardo, G., et al. (2018) Combining field data with infrared thermography and DInSAR surveys to evaluate the activity of landslides: The case study of Randazzo Landslide (NE Sicily). Landslides, 15, pp. 2173–2193. doi.org/10.1007/s10346-018-1026-9.
- Deng, M. D., et al. (1994) Study on the infrared waveband radiation characteristics of rocks. J. Infrared Millim. Waves, 13, pp. 425–430.
- Deng, M. D., et al. (1995) The rule and characteristics of infrared radiation temperature along with stress of rock and their relation to AE rate. Northwestern Seismological Journal, 17, pp. 79–86.
- Wu, L X & Wang, J Z (1998) Infrared radiation features of coal and rocks under loading. International Journal of Rock Mechanics and Mining Sciences, 35, pp. 969–976. doi.org/10.1016/S0148-9062(98)00007-2.
- Wu, L. X., et al. (2000) Remote sensing rock mechanics (RSRM) and associated experimental studies. International Journal of Rock Mechanics and Mining Sciences, 37, pp. 879–888. doi.org/10.1016/S1365-1609(99)00066-0.
- Wu, L. X., et al. (2006) Precursors for rock fracturing and failure—Part I: IRR image abnormalities. International Journal of Rock Mechanics and Mining Sciences, 43, pp. 473–482. doi.org/10.1016/j.ijrmms.2005.09.002.
- Wu, L. X., et al. (2006) Precursors for rock fracturing and failure—Part II: IRR T-Curve abnormalities. International Journal of Rock Mechanics and Mining Sciences, 43, pp. 483–493. doi.org/10.1016/j.ijrmms.2005.09.001.
- Freund, F T (2003) Rocks that crackle and sparkle and glow: Strange pre-earthquake phenomena. Journal of Scientific Exploration, 17, pp. 37–71.
- Cao, K. W., et al. (2020) An experimental study of infrared radiation characteristics of sandstone in dilatancy process. International Journal of Rock Mechanics and Mining Sciences, 136, p. 104503. doi.org/10.1016/j.ijrmms.2020.104503.
- Ma, L. Q., et al. (2021) Prediction of sandstone dilatancy point in different water contents using infrared radiation characteristic: Experimental and machine learning approaches. Lithosphere, 2021, p. 3243070. doi.org/10.2113/2022/3243070.
- Li, Z., et al. (2018) Experimental study on the infrared thermal imaging of a coal fracture under the coupled effects of stress and gas. Journal of Natural Gas Science and Engineering, 55, pp. 444–451. doi.org/10.1016/j.jngse.2018.05.019.
- Liu, S. J., et al. (2015) Quantitative analysis methods of infrared radiation temperature field variation in rock loading process. Chinese Journal of Rock Mechanics and Engineering, 34, pp. 2968–2976.
- Ma, L. Q., et al. (2019) An experimental study on infrared radiation characteristics of sandstone samples under uniaxial loading. Rock Mechanics and Rock Engineering, 52, pp. 3493–3500. doi.org/10.1007/s00603-018-1688-6.
- Liu, W., et al. (2021) Using the characteristics of infrared radiation b-value during the rock fracture process to offer a precursor for serious failure. Infrared Physics & Technology, 114, p. 103644. doi.org/10.1016/j.infrared.2021.103644.
- Mandelbrot, B. B., et al. (1984) Fractal Character of fracture surfaces of metals. Nature, 308, pp. 721–722. doi.org/10.1038/308721a0.
- Qiu, L., et al. (2020) Multifractal of electromagnetic waveform and spectrum about coal rock samples subjected to uniaxial compression. Fractals, 28, p. 2050061. doi.org/10.1142/S0218348X20500619.
- Kong, X., et al. (2019) Fractals and chaos characteristics of acoustic emission energy about gas-bearing coal during loaded failure. Fractals, 27, p. 1950072. doi.org/10.1142/S0218348X19500725.
- Kong, B., et al. (2019) Study on the feature of electromagnetic radiation under coal oxidation and temperature rise based on multifractal theory. Fractals, 27, p. 1950038. doi.org/10.1142/S0218348X19500385.
- Cai, X., et al. (2020) Water saturation effects on thermal infrared radiation features of rock materials during deformation and fracturing. Rock Mechanics and Rock Engineering, 53, pp. 4839–4856. doi.org/10.1007/s00603-020-02185-1.
- Luong, M P (2007) Introducing infrared thermography in soil dynamics. Infrared Physics & Technology, 49, pp. 306–311. doi.org/10.1016/j.infrared.2006.06.025.
- Feng, J. J., et al. (2021) Time-varying multifractal analysis of crack propagation and internal fracture process of coal under dynamic loading. Fractals, 29, p. 2150089. doi.org/10.1142/S0218348X21500894.
- Li, H., et al. (2019) Acoustic emission multi-parameter analysis of dry and saturated sandstone with cracks under uniaxial compression. Energies, 12, p. 1959. doi.org/10.3390/en12101959.