Sponsored by PerkinElmerReviewed by Olivia FrostAug 24 2023
Dust in the workplace is a primary cause of occupational disease hazards that harm workers' health. Free silica in dust is the leading cause of silicosis; hence analyzing the content of free silica in dust is an important part of occupational health monitoring.
Image Credit: ShutterStock/Jade ThaiCatwalk
Free silica refers to silica in a free state that is not associatedwith metals or metal oxides. In work settings, dust containing over 10% free silica is termed silica dust. Three classifications of free silica exist, namely crystalline, cryptomorphic, and amorphous silica, each of which is defined by its distinct crystal structures.
In China, the quantitative determination of free silica in dust in the workplace generally follows the GBZ/T192.4- 2007 standard method "Determination of Free Silica Content in Airborne Dust in the Workplace Part 4".
This standard measurement encompasses various techniques to ascertain free silica, such as the pyrophosphoric acid method, infrared spectroscopy, and X-Ray diffraction.
The pyrophosphoric acid method can determine the total amount of free silica. However, it is a manual method and is thus subject to the analyst's chemical analysis skills and can be time-consuming.
According to GBZ/T192.4-2007, an infrared spectrometer can be used to establish α-SiO2 (crystalline) standard curve and then substitute the absorbance value measured by the sample to obtain its quantitative value.
This infrared method, in combination with the pyrophosphoric acid method, is much simpler in terms of operation, as no solvents are required. The analysis is also faster and more accurate, rendering it the more popular method.
The PerkinElmer Spectrum Two™ research-grade infrared spectrometer boasts numerous appealing attributes, including the Dynascan interferometer, designed for stability, patented OpticsGuard technology to safeguard optics, and Absolute Virtual Instrument (AVI) standard calibration for enhanced, dependable analytical results.
It encompasses Atmospheric Vapor Compensation (AVC), which mitigates the impacts of undesired atmospheric absorptions — specifically carbon dioxide and water vapor — in sample spectra, even amidst varying environmental conditions in real-time.
With its OpticsGuard technology, the FTIR instrument eliminates the need for specific ambient humidity conditions, alleviating the need for frequent desiccant replacement by the user.
With a lifetime of more than three years, the desiccant in the Spectrum Two FTIR is ideally suited for precision-demanding analysis projects that prioritize detection accuracy and analytical efficiency. In addition, PerkinElmer stands at the forefront of the industry as the premier provider of FTIR analysis systems for free silica content.
The steps involved in collecting, calculating and reporting are all integrated into a dedicated free silica content operation software. Analysis can be performed with a "one-click" operation, greatly simplifying the whole analytical process.
For the standard sample preparation, a mixture is created by combining 10 mg of α-SiO2 with 990 mg of 200-mesh potassium bromide powder. The resultant mixture is employed as the standard sample.
Table 1. α-SiO2 calibration standards composition. Source: PerkinElmer
| Sample No. |
Sample weight (mg) |
Potassium bromide weight (mg) |
α-SiO2 actual content (mg) |
| 1 |
8 |
242 |
0.08 |
| 2 |
18 |
232 |
0.18 |
| 3 |
31 |
219 |
0.31 |
| 4 |
51 |
199 |
0.51 |
| 5 |
85 |
165 |
0.85 |
| 6 |
109 |
141 |
1.09 |
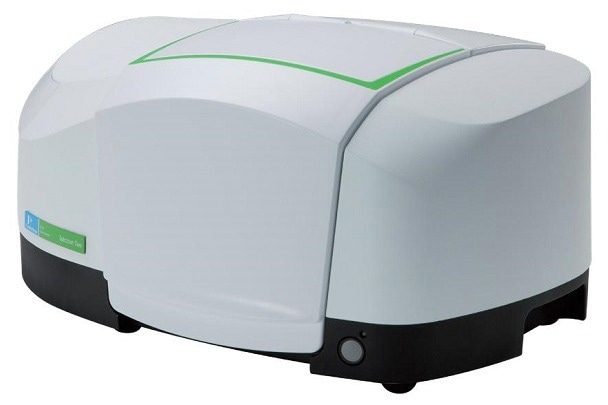
Figure 1. Spectrum Two™. Image Credit: PerkinElmer
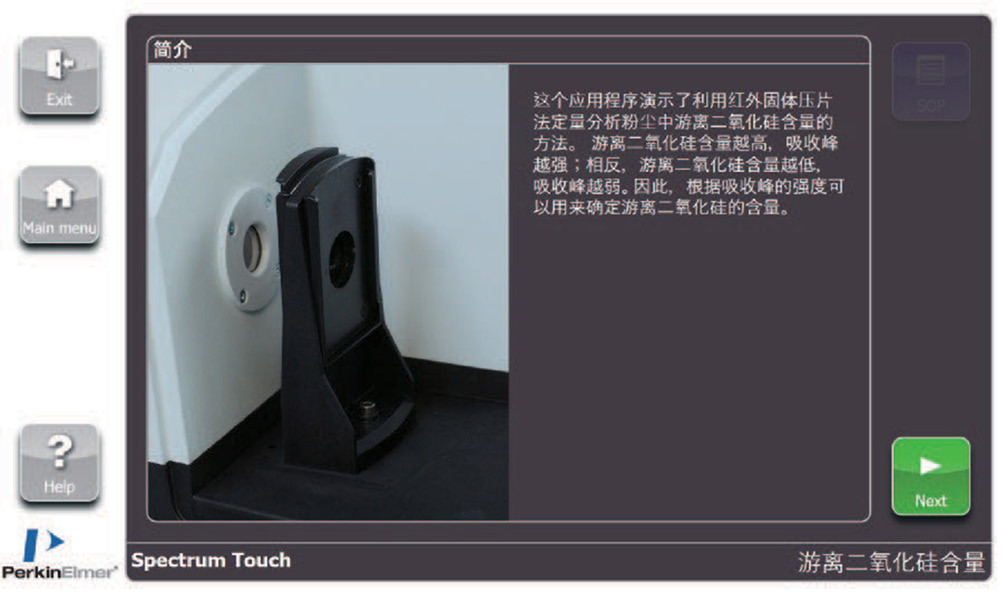
Figure 2. PerkinElmer dedicated software for free silica in dust analysis. Image Credit: PerkinElmer
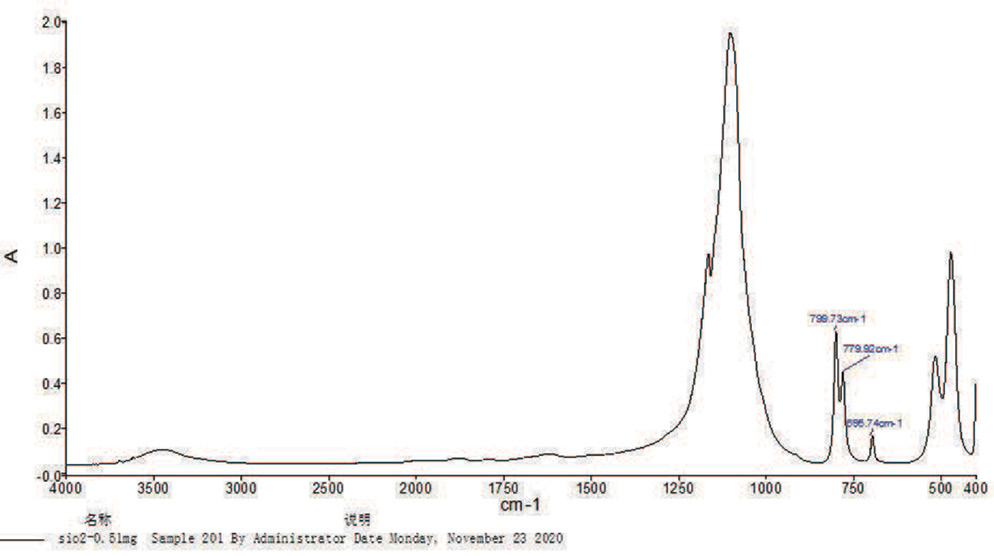
Figure 3. Infrared absorption spectrum of free silica. Image Credit: PerkinElmer
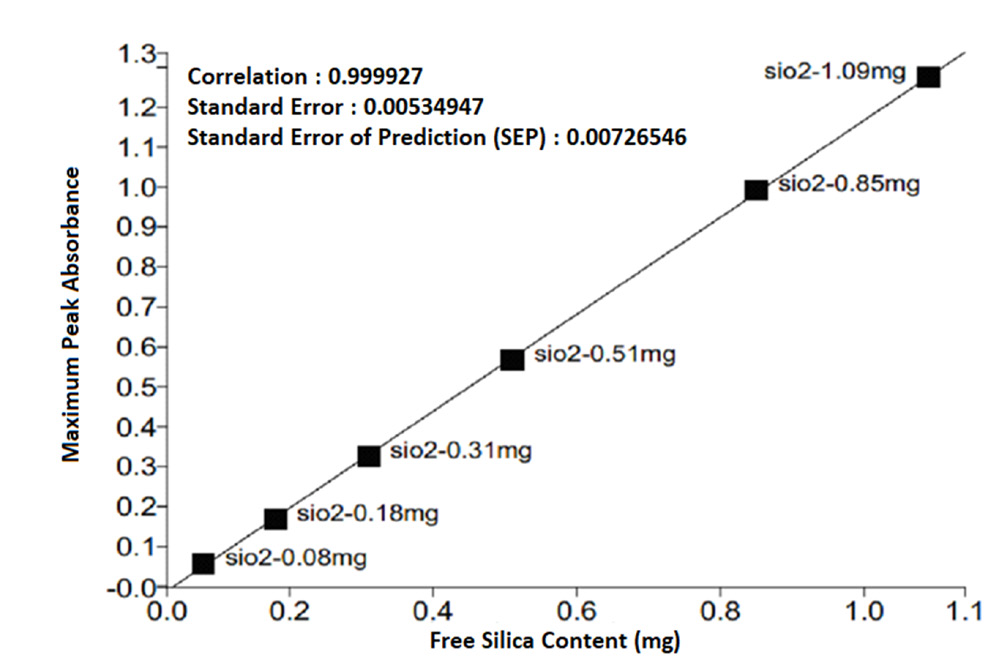
Figure 4. Standard calibration curve of free silica around 800 cm-1 (this standard curve is used for quantification when there is no interference). Image Credit: PerkinElmer
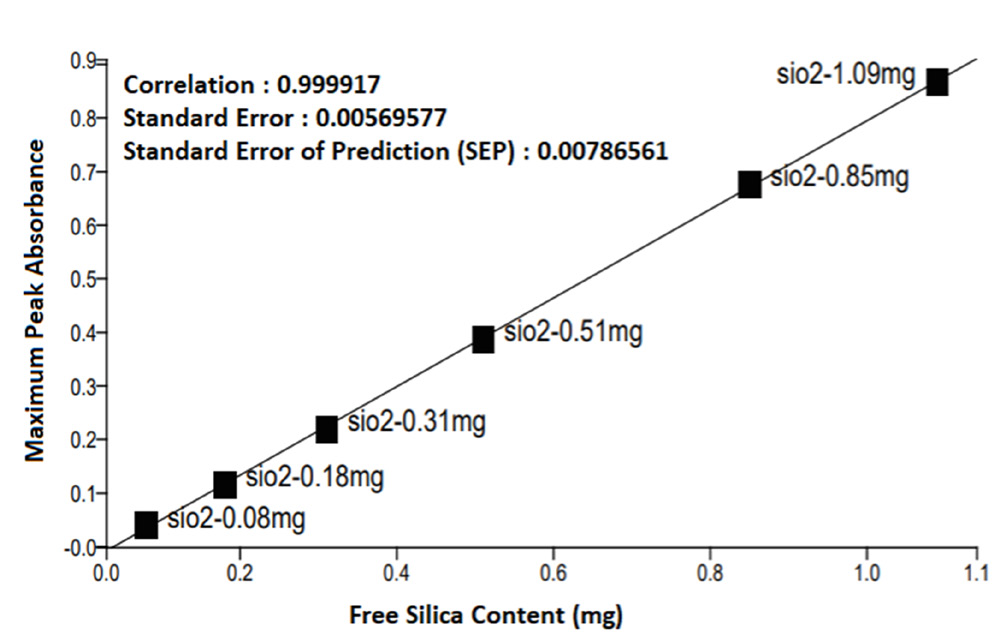
Figure 5. Standard calibration curve of free silica around 780 cm-1. Image Credit: PerkinElmer
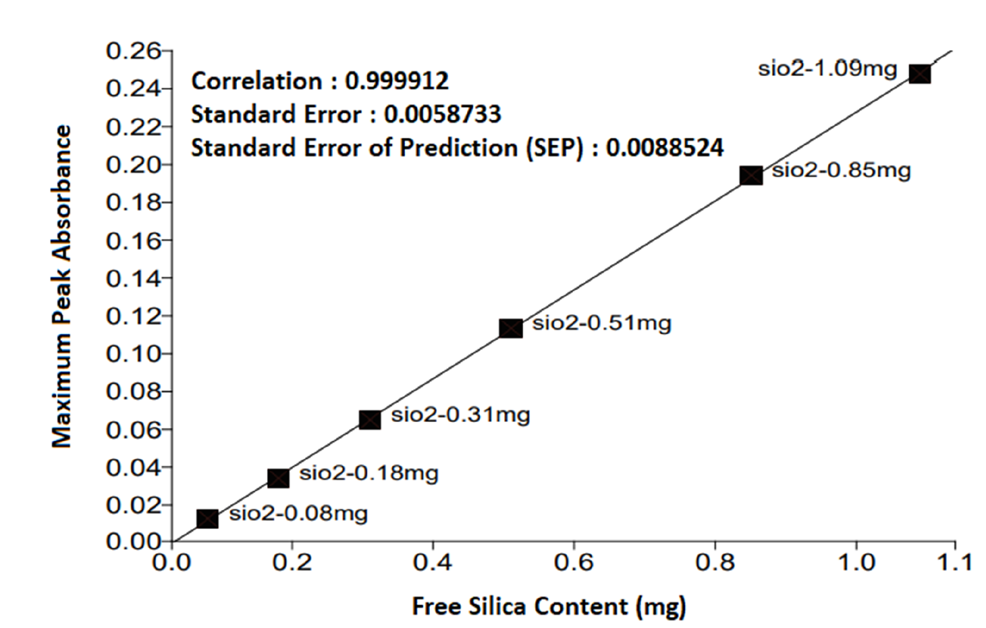
Figure 6. Standard calibration curve of free silica near 694 cm-1 (calibration curve can be used when the dust contains clay, mica, amphibole, feldspar and other components). Image Credit: PerkinElmer
Table 2. Reference range values for free silica quality control samples. Source: PerkinElmer
| Sample ID |
Reference range values (%) |
| GDOHZKTG012-1 |
2.3-5.8 |
| GDOHZKTG012-2 |
45.0-56.0 |
The subsequent steps involve weighing an appropriate quantity of both samples, transferring them to a muffle furnace, and subjecting them to incineration at 550 °C for one hour.
After the samples have cooled to room temperature, a combination of 250 mg of potassium bromide powder with each sample is prepared to yield two distinct mixtures, poised for subsequent measurement.
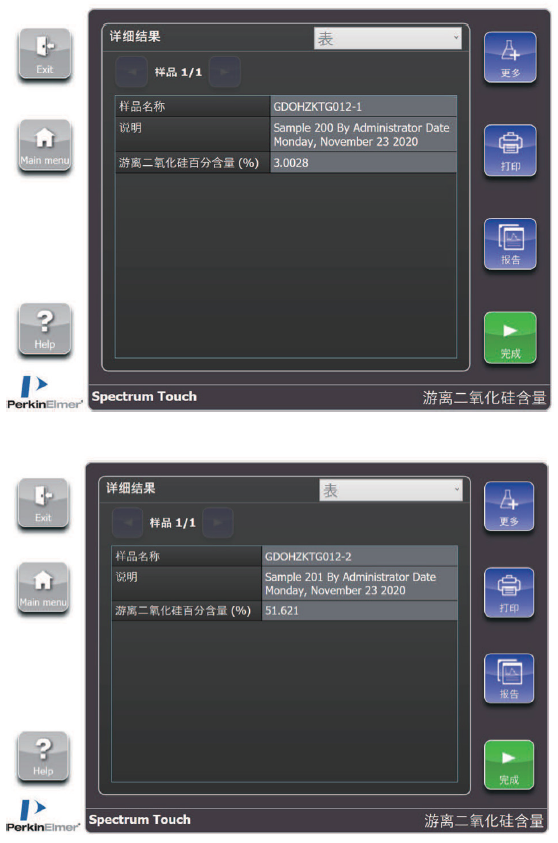
Figure 7. Percentage of free silica in the quality control samples. Image Credit: PerkinElmer

This information has been sourced, reviewed and adapted from materials provided by PerkinElmer.
For more information on this source, please visit PerkinElmer.