A study on the scientific journal Precambrian Research was recently published by researcher Sebastian Fuchs from the GEOMAR–Helmholtz Centre of Ocean Research Kiel (Germany) and his coworkers. This study gives an explanation for the formation of uranium and gold ore related to fossil hydrocarbons in the Witwatersrand basin.
In this analysis, an innovative workflow for the characterization of geological samples, such as focused-ion beam SEM (FIB-SEM) nanotomography, large area scanning-electron microscope (SEM) imaging, and scanning-transmission electron microscope (S)TEM analyses, were used that demonstrated some remarkable proof for the interaction of two immiscible fluids, such as hydrocarbon and hydrothermal liquids (oils)and also the formation of micro-emulsions that resulted in the deposition of native uraninite and gold.
The research team prepared the case for a wide mobilization of uranium in hydrocarbon fluids as well as gold in hot aqueous fluids, and then put forward a unifying mineralization model that describes the relationship of both metals in the carbon seams.
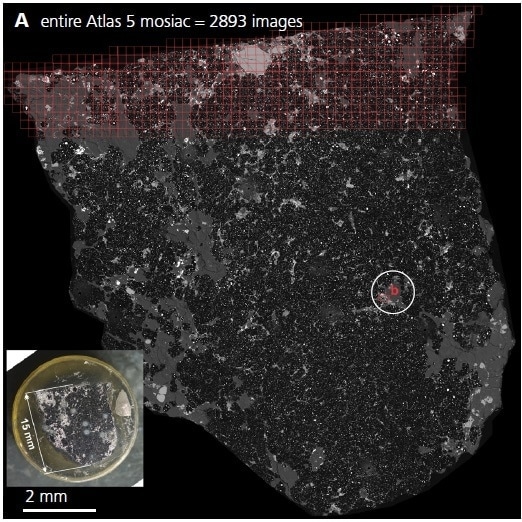
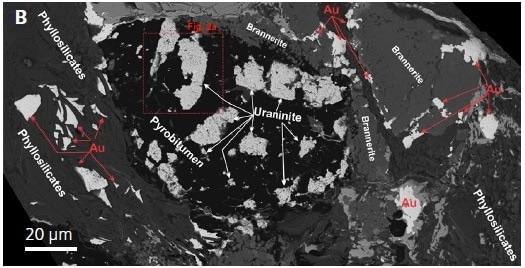
Figure 1. Backscattered electron (BSE) SEM images of a Carbon Leader Reef sample. (A) Atlas 5 large-area SEM image mosaic of the entire sample. (B) Higher-resolution SEM-BSE image mosaic of area ‘‘b” in image (A). The image shows pyrobitumen nodules that contain irregularly shaped uraninite grains.
The Formation of Gold and Uranium Ore in the Witwatersrand Deposits
Located in the central part of the Kaapvaal Craton in South Africa, the Mesoarchean Witwatersrand basin is a sequence of metasedimentary rocks that span 7.5 km and include conglomerates, shales, and quartzites. The highest concentration of uraninite and gold takes place in conglomerate units, also known as “reefs” (minable units). Seams of organic matter have a close spatial association with these reefs, indicating a key role in the ore-forming process. Within the Witwatersrand, the formation of uranium and gold ore has been an ongoing debate, with opinions often divided on whether the ores are hydrothermally remobilized paleoplacers or fully hydrothermal in origin.
Another aspect that is under significant debate is the origin of the hydrocarbon seams in the Witwatersrand. In some studies, it was inferred that the carbon seams are residues of algal (microbial) mats that originally formed either during or soon after sedimentation (Hallbauer, 1975; Hallbauer and van Warmelo, 1974; Mossman et al., 2008), while others have opined that carbon seams are remnants of hydrocarbon liquids (Drennan et al., 1999; Drennan and Robb, 2006; England et al., 2002; Fuchs et al., 2016; Gray et al., 1998).
Gold’s association with hydrocarbon seams in the hydrothermal model and also hydrothermal remobilization in the refurbished paleoplacer model can be explained by the need for a reductant so as to destabilize the bisulfide complexes, which are considered to be responsible for the transport of gold (Phillips and Law, 2000; Phillips and Powell, 2011). Different types of oil inclusions maintained in quartz grains demonstrate the proof that solid organic matter (pyrobitumen) is obtained from previously liquid basin-wide circulating oils.
In the present analysis, the research team employed an analytical workflow of ZEISS Atlas 5 large-area SEM imaging, and then used FIB-SEM nanotomography and (S)TEM to examine the nature of hydrocarbon, uranium, and gold mineralizations from micrometer to nanometer scale. Using the ZEISS Atlas 5 SEM imaging (including element distribution mapping and EDS spot analyses), minerals bearing gold, uranium, and hydrocarbons were identified to study their growth features, distribution, and delicate textures (Figure 1). On the basis of the Atlas 5 dataset, the authors opted for gold-bearing uraninite aggregates as targets for FIB extraction and 3D nanotomography for (S)TEM analyses (Figure 2A).
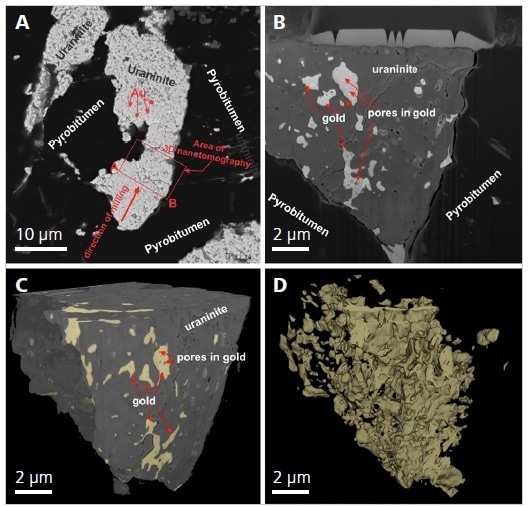
Figure 2.(A) Backscattered electron SEM image of the uraninite aggregate that was selected for FIB-SEM nanotomography and from which the 3D model was produced. The red box indicates the area that was milled to create the 3D model. (B) InLens image from the 3D data set. (C) A reconstructed stack image of the Atlas 3D nanotomography data set showing the uraninite grain with gold in its pore spaces. (D) A reconstructed stack image of the data set with only the gold shown, demonstrating that the gold fills pore space in the uraninite aggregate. The Atlas 3D image data set was segmented, and the grey levels associated with the uraninite aggregate were removed. For better visualization, uraninite and gold were displayed by grey and yellow false colors, respectively.
The latter showed that considerable volumes of gold are present in the micro-pores and fractures of aggregates of uraninite nanocrystals. All the gold grains observed thus far have ellipsoidal to spherical pores containing uraninite nanocrystals in a thin seam of pyrobitumen (a fossil residue of crude oil) that lines the pores’ inner walls. The 3D FIB-SEM nano-tomography was performed to view the distribution of pyrobitumen- and uraninite-filled pore holes in the gold grains and also the distribution of the enclosed gold grains in the uraninite aggregates (Figure 2B, C, D; movie clip).
Through the joint usage of the aforementioned set of methods, and based on the results obtained, the team successfully proposed a mineralization model for the formation of gold and uranium ore. This model shows that previously liquid hydrocarbons (oil) not only dissolved uranium but also transported it to the deposit site. The two immiscible phases, remaining in contact with gold-bearing, high-temperature hydrothermal fluids, formed oil-in-water micro-emulsions, which initiated the flocculation of uraninite nanocrystals. Chemical reduction of dissolved gold species to native gold causes the oil droplets present in the hydrothermal fluids to push the precipitation of native gold in the pores within large aggregates of uraninite. The sudden release and growth of gold crystals entrapped huge volumes of oil droplets that were thermally changed into a pyrobitumen residue.
Materials and Methods
At Fibics Incorporated (Ottawa, Canada), hydrocarbon-bearing samples and gold-uraninite samples from the Carbon Leader Reef in the Witwatersrand basin were imaged with the help of a ZEISS Sigma HD VP field-emission scanning-electron microscope (FE-SEM) using the large-area imaging software ZEISS Atlas 5. All the samples were imaged using the backscattered electron (BSE) detector, with an accelerating voltage of 14 kV and with a working distance of 11.8 mm, a beam current (120 mm aperture) of 7 nA, a resolution of 45 nm/pixel, and a 1.0 μs dwell time.
The sample’s image mosaic contains 2893 images, with each image tile consisting of 6148 x 6148 pixels (field of view per image about 277 x 277 μm). Moreover, a number of target regions were imaged at 5 nm/pixel resolution.
After stitching and correcting the large-area image mosaics obtained by the ZEISS Atlas 5 software, the complete datasets were exported to an independent set of files known as the Browser-Based Viewer (BBV).
BBV enables the user to visualize the entire dataset at full resolution through a web browser, akin to that of the famous Google Earth™ application. The end of this article contains the link to the ZEISS Atlas 5 BBV data set of the sample from the Carbon Leader Reef.
At Fibics Incorporated (Ottawa, Canada), energy-dispersive spectroscopic (EDS) and High-resolution FIB-SEM nanotomography analyses were performed on a Carl Zeiss Crossbeam 540 SEM fitted with a Capella Gallium ion FIB column, a Gemini 2 electron column, and an Oxford Instruments X-MaxN 80 mm2 energy-dispersive X-ray spectroscopy (EDS) detector controlled through the Aztec 3.0 software.
All nanotomography runs employed the Atlas 3D module of the Atlas 5™ software, which enables interlaced milling and imaging. Overall, 1212 successive images were obtained with an average mill progression of 5 nm for each image. Next, the image stacks, thus obtained, were loaded into the 3D visualization software called “Dragonfly,” then the same were rendered into 3D models with 5 nm voxels, and finally exported into a number of video files. These video files were subsequently loaded into the movie software known as “Camtasia” and combined into single videos with annotations.
The TEM work was performed at the National Research Council (Ottawa, Canada) and the Facility for Electron Microscopy Research (FEMR) at McGill University (Montréal, Canada).
Data Resources
Original work
Fuchs, S.H.J., D. Schumann, A.E. Williams-Jones, A.J. Murray, M. Couillard, K. Lagarec, M.W. Phaneuf, H. Vali, 2017: Gold and uranium concentration by interaction of immiscible fluids (hydrothermal and hydrocarbon) in the Carbon Leader Reef, Witwatersrand Supergroup, South Africa. Precambrian Research,293, 39–55, dx.doi.org/10.1016/j.precamres.2017.03.007
The full articles can be downloaded under: http://www.sciencedirect.com/science/article/pii/S0301926816304727
The ZEISS Atlas 5 large area image mosaic can be downloaded under:https://asset-downloads.zeiss.com/catalogs/download/mic/cfab5bc9-767b-443d-8952-5086add8d5b4/EN_wp_Atlas-5_large-area-imaging.pdf
The animated movie clip of the 3D nanotomography of the Witwatersrand uraninite grain can be downloaded under: https://asset-downloads.zeiss.com/catalogs/download/mic/7575a3f7-9585-4f1f-9188-284d3f5f16a7/EN_wp_Visualization_gold_uranium_Witwatersrand.pdf
References
Drennan, G.R., Boiron, M.C., Cathelineau, M., Robb, L.J., 1999. Characteristics of post-depositional fluids in the Witwatersrand Basin. Mineralogy and Petrology, 66(1-3): 83-109.
Drennan, G.R., Robb, L.J., 2006. The nature of hydrocarbons and related fluids in the Witwatersrand Basin, South Africa: Their role in metal redistribution. Geological Society of America Special Papers,405: 353-385.
England, G.L., Rasmussen, B., Krapež, B., Groves, D.I., 2002. Archaean oil migration in the Witwatersrand Basin of South Africa. Journal of the Geological Society, 159: 189-201.
Fuchs, S., Williams-Jones, A.E., Jackson, S.E., Przyblowicz, W., 2016. Metal distribution in pyrobitumen of the Carbon Leader Reef, Witwatersrand Supergroup, South Africa: Evidence for liquid hydrocarbon ore fluids. Chemical Geology, 426: 45-59.
Gray, G.J., Lawrence, S.R., Kenyon, K., Cornford, C., 1998. Nature and origin of “carbon” in the Archean Witwatersrand Basin, South Africa. Journal of the Geological Society,155(1): 39-59.
Hallbauer, D.K., 1975. Plant origin of the Witwatersrand carbon. Minerals Science and Engineering, 7(2): 111-131.
Hallbauer, D.K., van Warmelo, K.T., 1974. Fossilized plants in thucholite from Precambrian rocks of the Witwatersrand, South Africa. Precambrian Research,1(3): 199-212.
Mossman, D. et al., 2008. The indigenous origin of Witwatersrand “carbon”. Precambrian Research, 164(3-4): 173-186.
Phillips, G.N., Law, J.D.M., 2000. Witwatersrand gold fields: geology, genesis, and exploration. Reviews in Economic Geology, 13(13): 439-500.
Phillips, G.N., Powell, R., 2011. Origin of Witwatersrand gold: a metamorphic devolatilisation–hydrothermal replacement model. Applied Earth Science, 120(3): 112-129.
This information has been sourced, reviewed and adapted from materials provided by Carl Zeiss Microscopy GmbH.
For more information on this source, please visit Carl Zeiss Microscopy GmbH.