“Fugitive dust” refers to particulate matter that is lifted into the air either through natural forces or human activities in large, open areas. These particulates are commonly generated by activities such as soil movement, vehicle travel over unpaved surfaces, operation of heavy equipment, blasting, and wind.
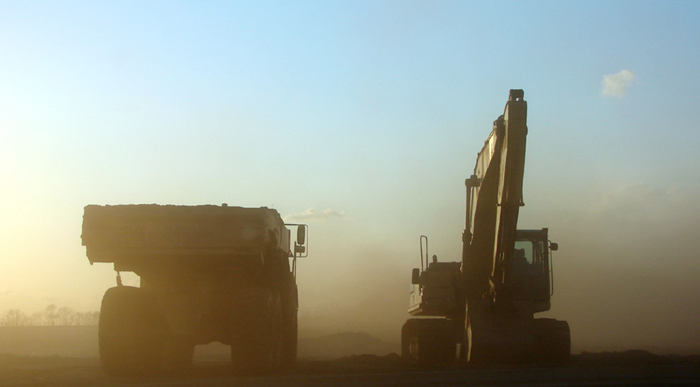
Image Credit: Thermo Fisher Scientific
Sources of Fugitive Dust
Aerosolized dirt on road construction sites is a frequent contributor to fugitive dust, along with the operation of agricultural equipment on unpaved roads or parched soils.
The storage and movement of aggregate piles also creates these fine particulates, most commonly referred to as dust bowl conditions.
Particulates caused by combustion (from motor vehicles or other internal combustion engines) and transformation operations, including soldering, brazing, and welding, are usually excluded from the general definition of fugitive dust.
This release into the atmosphere does not occur in a controlled manner and cannot be traced to a known source point with certainty. While multiple environmental regulatory groups establish definitions for dust sources and maximum exposure levels, evaluating the effectiveness of dust control plans remains challenging.
A method is needed for rapidly determining whether a site is exceeding exposure limits for regulatory compliance.
History
The Clean Air Act (CAA) of 1970 established the National Ambient Air Quality Standard (NAAQS) for a variety of hazardous pollutants, including particulate matter (PM).
Released in April 1971, the first regulatory measure for PM called for the measurement of total suspended particulate (TSP) in the range of 25 - 45 microns (μm). Exposure limits were based on a mass concentration (weight) for both a 24-hour average exposure limit (260 μg/m3) and an annual geometric mean (75 μg/m3).
The Development of Regulatory Standards in the Last 40 Years
Since 1971, these exposure values have been reevaluated and reduced, in both total permissible exposure and particulate size.
PM-2.5, or particulate matter up to 2.5 μm in size, has become the “standard,” as particles this size have caused the most significant adverse health effects.
For most fugitive dust applications, PM-10 measurements remain the most used due to their additional detrimental impacts.
A series of state and local air monitoring systems (SLAMS) supply data to the EPA’s Office of Air and Radiation’s (OAR) Aerometric Information Retrieval System (AIRS) database to ensure compliance with the NAAQS standards.
Although fugitive dust is not a direct component of the NAAQS, these emissions have a significant influence on overall particulate measurement and exposure limits.
Emissions are usually controlled by the local regulatory authority, including state EPA or DEQE, air quality management districts, air resource boards, and special program agencies.
Acceptable exposure levels and enforcement practices vary widely. Most regions impose exposure limits on projects that typically generate elevated particulate levels, and these limits are written into the operating permit.
The operating permits differ by project type. For example, for construction, remediation, and demolition, dust exposure is frequently permitted at higher levels than the NAAQS thresholds due to the nature of the work.
When concentrations approach the limit, dust emissions can be controlled through numerous local containment efforts. Temporary measures such as water sprays and cover materials minimize airborne dust during active work. As projects near completion, more permanent measures, such as landscaping or paving, help return emissions to normal ambient levels.
An example of a special program agency and program is the New York State Department of Environment Conservation (DEC) technical guidance document DER-10 for site investigation and remediation.
A copy of the DER-10 is available at www.dec.ny.gov/docs/remediation_hudson_pdf/ der10.pdf.
This document is not intended to address worker safety (respiratory concerns). Instead, it provides guidance on monitoring protocols to prevent exposure outside the active work zone.
A second appendix (1B) offers guidance on fugitive dust and particulate monitoring, along with dust control methods. Key parameters include instantaneous readings, broad measurement ranges, data logging, and visible alarms.
Since conditions at active work sites can change rapidly, such as when new sections are opened or dirt-moving operations occur, real-time monitoring is essential. (See reference A). Although the DER-10 applies only to work sites in New York State, it provides general guidance for effective monitoring practices and reflects regulations and guidelines used throughout the United States.
Similar practices are also commonly implemented internationally.
Fugitive dust contributes to multiple hazards. Areas with elevated concentrations experience reduced visibility and increased risk of traffic accidents.
Wind can carry away valuable topsoil, diminishing crop yields. In addition, workers and residents exposed to fugitive dust may face detrimental health impacts.
Most PM-10 particles in the environment originate from fugitive dust. Even “clean” dust can cause asthma and other breathing problems.
Particles containing hazardous substances, such as tire rubber, lead from sandblasting operations, asbestos from demolition, or silica from mining operations, can cause permanent lung damage.
Thermo Scientific Solution
Fugitive dust exposure monitoring requires instruments that respond rapidly, perform reliably, can be deployed or relocated quickly, and meet applicable guidelines.
For quick response, a light scattering device (nephelometer) provides real-time measurements necessary for immediate corrective action when exposure limits are exceeded. While choosing a nephelometer, it is crucial to ensure that it contains all the capabilities typically specified in the guidelines.
Since concentrations will likely vary depending on site activities, a broad measurement range is usually required for capturing heavy concentrations.
Additionally, consistently elevated concentrations can lead to significantly high dust loading on filter-based nephelometers, which can reduce flow and impair the performance of particulate sizing controls (cyclone or impactors).
Finally, since work areas of this type are often highly fluid with respect to specific areas being monitored, it is important to select a tool that allows rapid configuration and can endure typical monitoring conditions (e.g. ,heat, rain, wind).
The Thermo Scientific™ ADR-1500 Area Dust monitor was engineered for fugitive dust applications, offering a self-contained system enclosed in an IP65 weather-proof case. The ADR-1500 monitor is lightweight and can be carried by the handle and mounted on walls, posts, or an industrial tripod.
It operates on external AC or DC power and features an internal 12-volt lead-acid battery providing up to 100 hours of operation. Pressure, flow temperature, and humidity sensors allow the unit to maintain true volumetric flow, supporting consistent cyclone cut points.
To support heavy particulate loading, a large HEPA filter allows the unit to operate at elevated concentrations, allowing for extended periods of unattended monitoring.
The ADR-1500 Area Dust monitor offers the broadest measurement range of any deployable particulate monitor available. An integrated heater ensures accurate dust measurement by preventing moisture condensation.
An optional filter cassette holder allows material collection for post-monitoring gravimetric measurement, enhancing nephelometer mass measurement accuracy. A bright beacon provides rapid alarm notification, and internal data logging contains sufficient memory for several months of monitoring results.
A wearable, portable device offers similar capabilities, helping detect areas of increased concentrations and protect workers at the site.
The Thermo Scientific™ pDR1500 Personal Data Ram provides excellent utility and extended operation life with commercially available batteries. It possesses many of the key features of the ADR-1500 monitor, including volumetric flow control, broad concentration range, and a 37-mm filter for post-monitoring analysis.
The unit may also be utilized for any NIOSH technique 0500 or 0600 monitoring applications. Its compact, wearable design allows the device to deliver real-time feedback on exposure levels, allowing workers to quickly respond to increased levels, remove themselves from danger, and take action to mitigate the situation.
For increased precision, the Thermo Scientific™ SHARP 5030iQ monitor integrates a beta gauge and nephelometer, providing speed of light scattering with the accuracy and precision of beta attenuation for long-term operations.
The long-life filter tape advances automatically based on time or particulate loading, reducing maintenance. The integral Intelligent Moisture System regulates sample heating to maintain a temperature slightly above the dew point. The SHARP 5030iQ monitor is a US EPA PM-2.5 Equivalent Monitoring, enabling use for compliance monitoring.
For crucial applications, a SHARP 5030iQ monitor with multiple ADR-1500 units enables both effective perimeter monitoring and the ability to determine the origin of heavy particulates.
The triangulated ADR-1500 units provide data on the dust source (location and time of elevated readings) at an economical cost, and the SHARP provides the low-end sensitivity needed for ensuring compliance with applicable regulations.
Table 1. Summary of National Ambient Air Quality Standard Promulgated for Particulate Matter 1971-2006. Source: Thermo Fisher Scientific
| Final rule |
Indicator |
Average time |
Level |
Form |
1971
(36 FR
8186) |
TSP - Total
suspended
Particulate
(≤25 - 45 μm) |
24 hour |
260 μg/m3
(primary) |
Not to be exceeded for more than one year |
150 μg/m3
(secondary) |
| Annual |
150 μg/m3
(secondary) |
Annual average |
1987
(52 FR
24634) |
PM10 |
24 hour |
150 μg/m3
(primary) |
Not to be exceeded more than once in a year on average over a 3-year period |
| Annual |
50 μg/m3
(secondary) |
Annual arithmetic mean, average over 3 years |
1997
(62 FR
38652) |
PM2.5 |
24 hour |
65 μg/m3 |
98th percentile, averaged over 3 years |
| Annual |
15 μg/m3 |
Annual arithmetic mean, average over 3 years |
| PM10 |
24 hour |
150 μg/m3 |
Initially promulgated 99th percentile averaged over 3 years; when 1997 standards were vacated, the form of 1987 standards remained in place (not to be exceeded more than once per year on average over a 3-year period) |
| Annual |
50 μg/m3 |
Annual arithmetic mean, average over 3 years |
2006
(71 FR
61144) |
PM2.5 |
24 hour |
35 μg/m3
(primary) |
98th percentile, averaged over 3 years |
15 μg/m3
(secondary) |
Annual arithmetic mean, average over 3 years |
| PM10 |
Annual |
150 μg/m3
(secondary) |
Not to be exceeded more than once per year on average over a 3-year period |
Summary
Fugitive dust poses ongoing hazards to human health and the environment due to the activities that produce it. Although different sites require different solutions, the ability to rapidly detect dust concentration levels and potential sources is essential for achieving regulatory compliance. Thermo Fisher Scientific offers a broad range of monitoring solutions, technical expertise, and support to help address these challenges effectively.
Acknowledgements
Produced from materials originally authored by Bob Gallagher, Product Line Manager (Thermo Fisher Scientific).

This information has been sourced, reviewed, and adapted from materials provided by Thermo Fisher Scientific – Production Process & Analytics.
For more information on this source, please visit Thermo Fisher Scientific – Dust Monitoring.