Sponsored by TescanReviewed by Ify IsiborJul 23 2026
Gold (Au) is one of the key commodities in the global mining sector. However, the natural variation in gold recovery in a mining operation is often misunderstood, significantly impacting its economics.
Variability in gold recovery is controlled by several mineralogical factors, including the gold mineral type, the gold grain size distribution, the gangue mineral host, and the presence of gold as a mineral lattice substitution or a submicrometer-size inclusion in minerals such as sulfides, sulfates, or oxides.
Gangue minerals can strongly impact gold recovery, as they can 1) compete with gold for cyanide (e.g., copper minerals), 2) preg-rob gold during leaching (organic carbon), 3) deliver rheological issues (e.g., clays/micas), and 4) require ore washing (soluble sulfates).
These factors highlight the importance of an integrated geometallurgical study that integrates geological inputs, bulk mineralogy, gold mineralogy, geochemistry, and metallurgical assessment into effective geometallurgical modeling and gold recovery prediction.
Method
Figure 1 depicts a simplified flowsheet used in a geometallurgical gold study. In this study, the geomet assessment samples are defined as continuous intervals of drill core ore or potentially coarse assay rejects measuring approximately 10 to 20 m in length from key geological domains within the resource.
Samples are ground in the laboratory to enable mineralogical and metallurgical comparison assessment. The ground feed undergoes: 1) bulk mineralogy using the TIMA (TESCAN Integrated Mineral Analyzer) in liberation mode, 2) bottle roll cyanidation to connect mineralogical data with metallurgical response, and 3) the measurement of refractory (solid solution or colloidal) gold using SIMS (Secondary Ion Mass Spectroscopy) in sulfide or oxide species if suspected.
To measure gold deportment to concentrate or tails, the remaining sample undergoes gravity concentration using a Knelson concentrator and/or a Superpanner table. TIMA bright-phase mode analyzes all gravity fractions to identify, measure, and characterize gold occurrences.
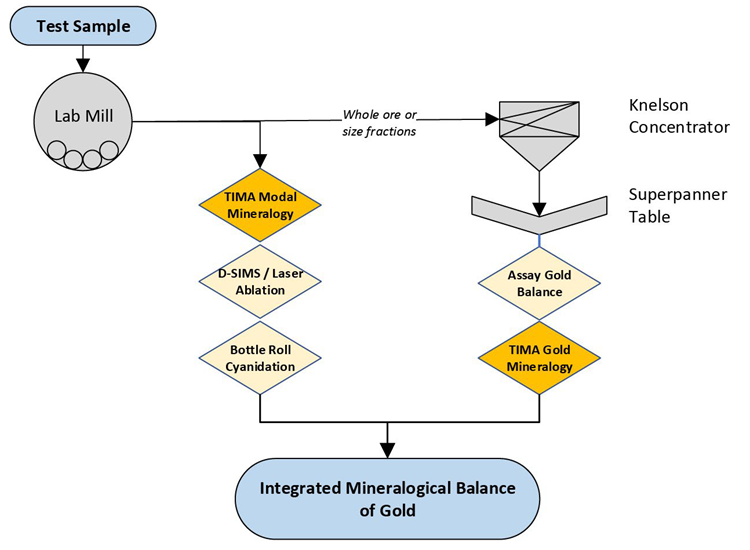
Figure 1. Simplified Gold Mineralogy Testing Flowsheet. Image Credit: Tescan
Bulk Sample Mineralogy
Measuring the geomet sample's bulk mineralogy connects it to the logged geological domain (lithology, alteration, and oxidation), providing possible explanations for variable gold leaching performance.
Figure 2 displays the bulk mineralogy of the geomet sample from various geological domains in a high-sulfidation epithermal gold deposit. Samples are sorted in decreasing order of bottle-roll cyanidation gold recovery (black line).
Quartz-dominated samples exhibit the highest gold recovery. Gold recovery declines slightly in zones containing alunite and then falls sharply in domains containing both alunite and pyrite. Refractory gold in sulfides was suspected and subsequently verified using SIMS.
The influence of alunite on gold recovery was unanticipated and remains under investigation. Notably, these three mineralogically based recovery domains are connected to the resource geology and can be mapped into the block model.
Gold Measurement
A variety of polished mounts is employed in a gold mineralogy study. Decisions must be made on how to optimally scan them for gold grains; this depends on the gold ore's mineralogy and texture. However, the larger grains will generally report to the concentrates, while the smaller grains will report to the tails.
The following examples originate from an operation with known fine-grained gold. Accordingly, the TIMA bright-phase search mode was tailored to guarantee the grain capture. Measurement of all samples was conducted using a 0.5 μm pixel size and a 500 μm FOV. Different parameters will be required for other resources containing coarser gold or gold hosted in sulfide minerals.
Exclusion of Non-Gold High BSE Minerals
The TIMA bright-phase search mode enables selective measurement of gold minerals while excluding other bright phases, such as galena, cinnabar, or barite, based on their EDS signatures. This filter significantly reduces total scan time, the output project file size, and the number of bright grains requiring post-measurement verification.
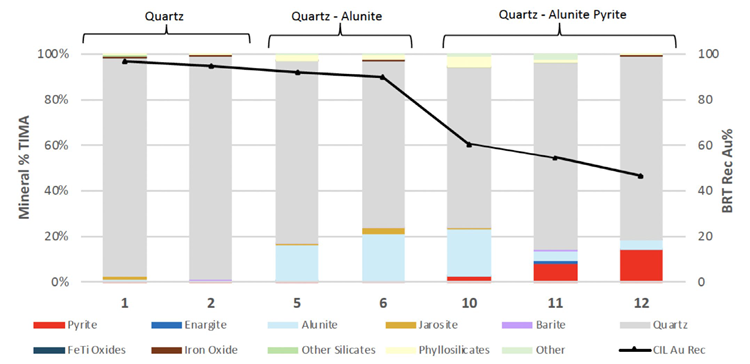
Figure 2. Bulk mineralogy of geomet samples obtained by TIMA. Samples are sorted in order of declining bottle-roll cyanidation gold recovery (black line). Image Credit: Tescan
Imaging
A particle containing a cluster of extremely fine-grained gold is illustrated in Figure 3. The overall particle mineralogy is shown on the left as a TIMA false-color particle map at 0.5 μm pixel size. In the center, a BSE image of the mapped particle highlights the bright grain cluster. A high-magnification photomicrograph of the gold grain cluster is presented on the right.
The scale bar shown is 10 μm. By using the TIMA bright-phase search measurement, the operator can navigate to the exact grain position, facilitating more in-depth inspection.
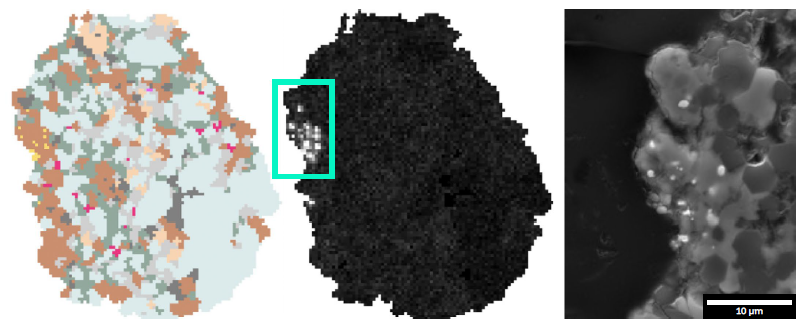
Figure 3. LEFT: TIMA mineral map showing location of gold grains (red box). MIDDLE: Elemental map of gold of the same particle showing a cluster of <1 μm gold grains. RIGHT: SEM-BSE image of gold grain cluster. Image Credit: Tescan
Data Outputs and Visualization
In gold mineralogy research, a picture is truly worth a thousand words. TIMA particle grids, elemental maps, and BSE photomicrographs effectively convey study results by displaying real examples of gold mineral grain size and their textural associations with other minerals.
A gold grain selection identified in the gravity concentrate and tail from Zone GMT-01 is shown in Figure 6. The concentrate recovered 5% of the total gold content. A single liberated gold grain was identified (arrow), and the rest of the gold was present as fine inclusions in iron oxides and quartz. In the tail (95% of the gold), all gold was present as extremely fine inclusions locked in quartz.
Figure 5 presents a high-magnification image of one of the quartz grains displayed in Figure 4, highlighting the exceptionally small size of the gold. The other quartz grains illustrated in Figure 4 contain gold inclusions of a similar size. These images demonstrate that the gold in this zone’s ore is exceptionally fine-grained and locked in impermeable quartz.
A selection of the gold occurrences in Zone GMT-02 is presented in Figure 6. Thirteen percent of the gold reported to the concentrate, which is more than twice that of Zone GMT-01, and a greater amount of the gold was associated with jarosite.
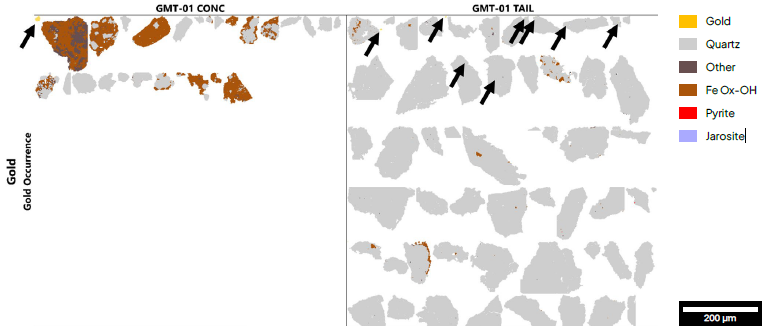
Figure 4. Gold grain occurrences in GMT-01 Concentrate and Tail. Each grid box is 1000 μm × 1000 μm. TIMA measurement resolution = 0.5 μm. Black arrow: Liberated gold. Image Credit: Tescan
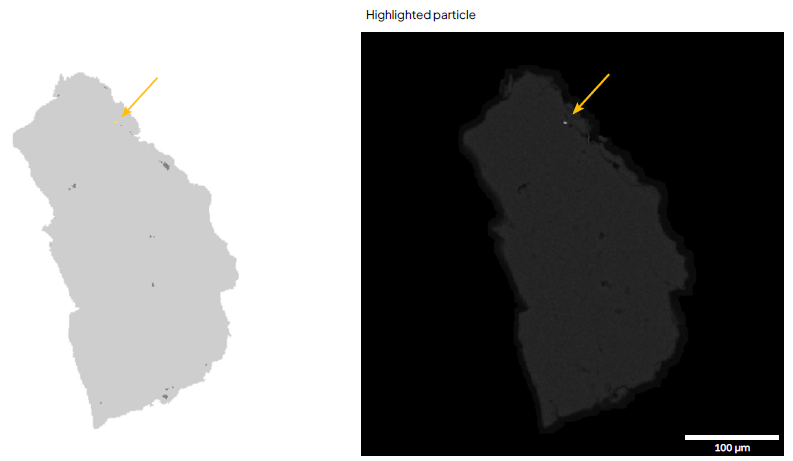
Figure 5. TIMA images showing tiny gold grain in quartz (~0.5 µm). LEFT: Phase map. RIGHT: BSE image. Image Credit: Tescan
The TIMA analysis was used to measure a substantial population of gold grains, enabling statistical evaluation of the gold grain size distribution (Figure 7). GMT-01 (blue) exhibited a larger grain population in the <1 μm size class, whereas GMT-02 displayed a greater population in the >2 μm class. Gold grain P80 (80% passing) sizes for GMT-01 and GMT were 1 μm and 4.5 μm, respectively.
Gold Association
Figure 6 shows the gangue mineral hosts for gold in both GMT-01 and GMT-02. Gold in GMT-01 was primarily hosted in quartz, whereas in GMT-02 it was more commonly hosted by Fe oxides and jarosite (see Figure 8).
This information offers additional insight into variations in gold leaching behavior between the two zones and may be used to inform a technique to identify regions in the resource with poorer performance.
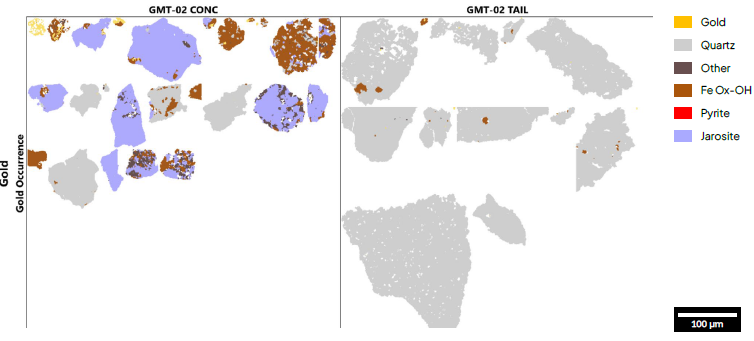
Figure 6. Gold grain occurrences in GMT-02 Concentrate and Tail. Each grid box is 1000 μm × 1000 μm. TIMA measurement resolution = 0.5 μm. Image Credit: Tescan
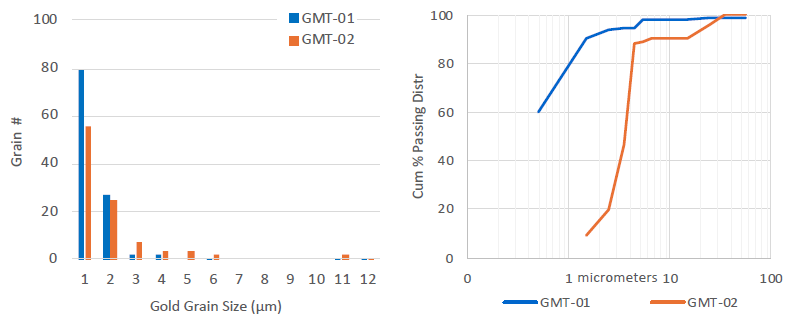
Figure 7. Gold grain size distribution. LEFT: Frequency by size. RIGHT: Gold grain size distribution. Image Credit: Tescan
Conclusion
TIMA technology offers valuable insights that improve understanding of the reasons behind metallurgical variability across a gold resource or operation. A geometallurgical program will employ:
- A liberation analysis mode for measuring bulk mineralogy that connects the sample to its logged geological domain. This mode also quantifies minerals that may host refractory gold (sulfides, oxides), minerals that can compete with gold for cyanide during leaching (copper sulfide, other base metals), clays, and phyllosilicates that can affect pulp rheology during leaching or on a heap.
- Bright-phase search mode, which facilitates the measurement of a statistically significant gold grain population at a specified magnification and resolution as small as 0.5 μm. The measurements enable comparative evaluation between geological/geometallurgical domains of:
- Gold mineralogy
- Gold grain size distribution
- Gold mineral associations
The TIMA measurements yield digital data outputs along with robust mineral liberation and textural imaging.
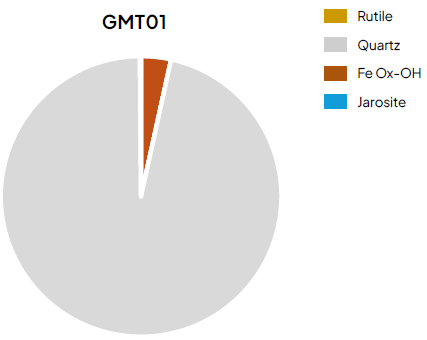
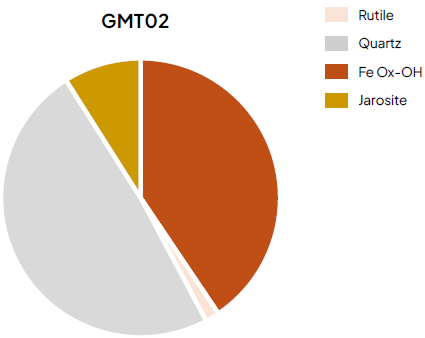
Figure 8. Gold mineral association. Image Credit: Tescan
Acknowledgments
Produced from materials originally authored by Nichola McKay, Blue Coast Research Ltd., British Columbia, Canada.

This information has been sourced, reviewed, and adapted from materials provided by TESCAN.
For more information on this source, please visit TESCAN.