Sponsored by TescanReviewed by Ify IsiborJul 23 2026
Drill core logging and petrographic research provide crucial early-stage insights into ore mineralogy, gangue mineral associations, and potential metallurgical challenges in a mineral exploration project. However, these detailed studies look at only small ore fragments and do not capture data at a mining production scale.
The next step in mineral project evaluation requires a more metallurgical approach using ‘representative’ ore-grade samples to evaluate the appropriate metallurgical flowsheet and the recoverability of valuable minerals. Italics are used here to emphasize the difficulty of defining a truly representative ore sample and the importance of the geometallurgical process.
It should be noted that mineral textural evaluation via TIMA (TESCAN Integrated Mineral Analyzer) can be applied at every project phase to deliver quantitative data on the natural/unbroken ore mineral grain-size distribution. This information can then be applied: 1) at early mineral project phases to guide metallurgical flowsheet development and ore zonation, and 2) at later mineral project or operations stages to diagnose spatial metallurgical variability.
Method
A sample preparation flowsheet for textural evaluation is presented in Figure 1. The overall aim is to quantify ‘unbroken’, or non-liberated, ore textures while using a crush size appropriate for TIMA analysis (Figure 1).
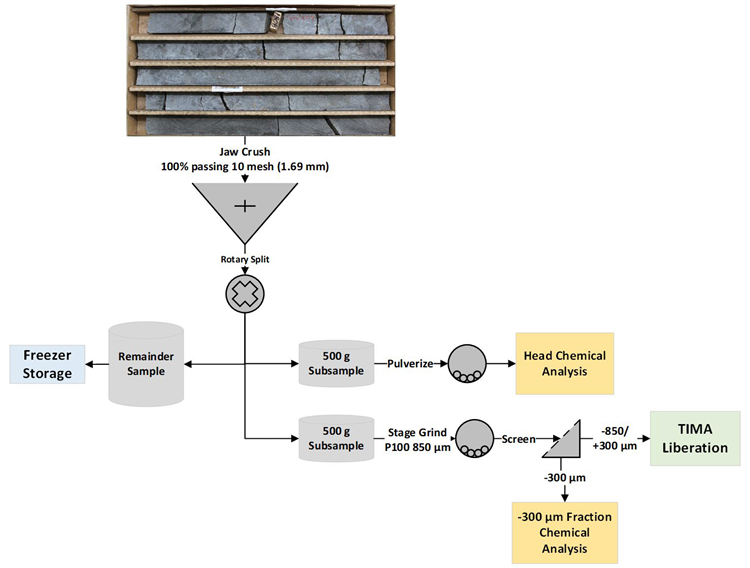
Figure 1. Ore Mineral Textural Testing Flowsheet. Image Credit: Tescan
Particle Mapping
Figure 2 shows TIMA particle maps for two coarsely crushed zinc (Zn) ore samples prepared employing this technique. Each measurement represents a continuous composite of 15 m of drill core.
These measurements covered a 25 mm diameter area and were acquired using a 4 μm pixel size and a 3000 μm field of view, with high-resolution mapping analytical mode. The TIMA particle maps show significant variations in both the sample's bulk mineralogy and the grain-size distribution of sphalerite.
These datasets can be interrogated to extract key ore textural parameters, including the overall sphalerite grain size distribution (influencing required grind size) and an evaluation of the main sphalerite middling particle types (influencing metallurgical flowsheet). These parameters affect the primary and regrind size required for effective sphalerite liberation and preparation of a high-quality zinc concentrate.
Sphalerite Grain Size, Liberation, and Gangue Mineral Associations
At this coarse crush size fraction of -850/+300 μm, the two samples exhibit pronounced differences in sphalerite grain size; Zone 1 has a median size of 284 μm, while Zone 2 has a median size of 39 μm.
This indicates that ore blocks in Zone 2 will necessitate a finer grind than those in Zone 1. This grain-size difference is further reflected in their respective sphalerite liberation profiles, where 33% of sphalerite occurs in particles with 80% liberation or higher, whereas this value is just 1% in Zone 2 (see Figure 3).
The samples exhibit significantly different middling associations of sphalerite gangue minerals. While Zone 1 features liberated sphalerite and middlings (or binary particles) with quartz and pyrite, Zone 2 is dominated by sphalerite middlings with quartz and barite. Moreover, Zone 2 displays an extremely high content of complex particles having sphalerite associated with multiple other minerals.
In addition, sphalerite occurs in just 34% of all Zone 1 particles compared to 86% of all Zone 2 particles. As a result, even at this coarse particle size, a substantial amount of non-mineralized grains can be separated or rejected from the sphalerite-bearing grains in Zone 1.
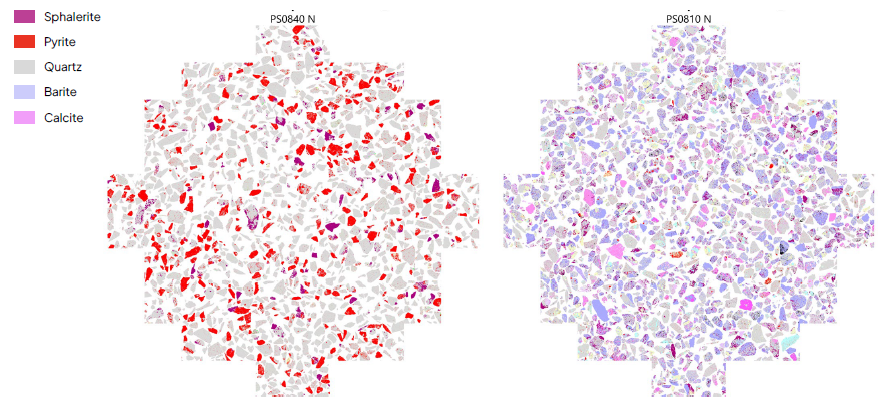
Figure 2. Zn ore particle maps prepared from a 15 m interval of crushed core. Maps are 25 mm in diameter. LEFT: Zone 1. RIGHT: Zone 2. Image Credit: Tescan
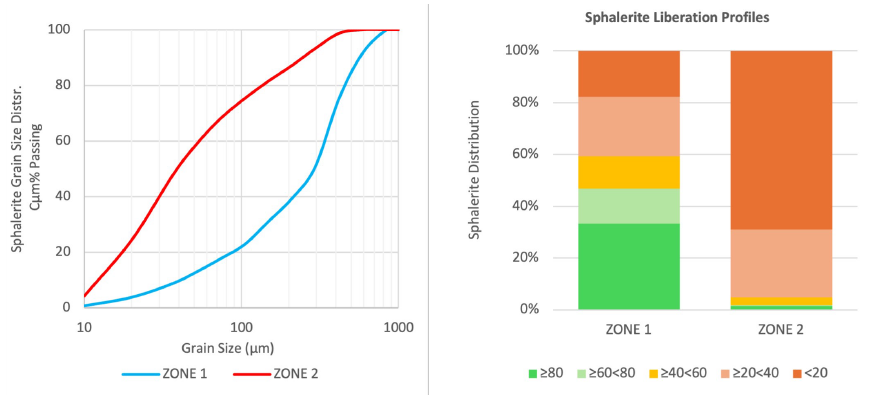
Figure 3. LEFT. Sphalerite grain size distribution. RIGHT: Sphalerite liberation by class. Image Credit: Tescan
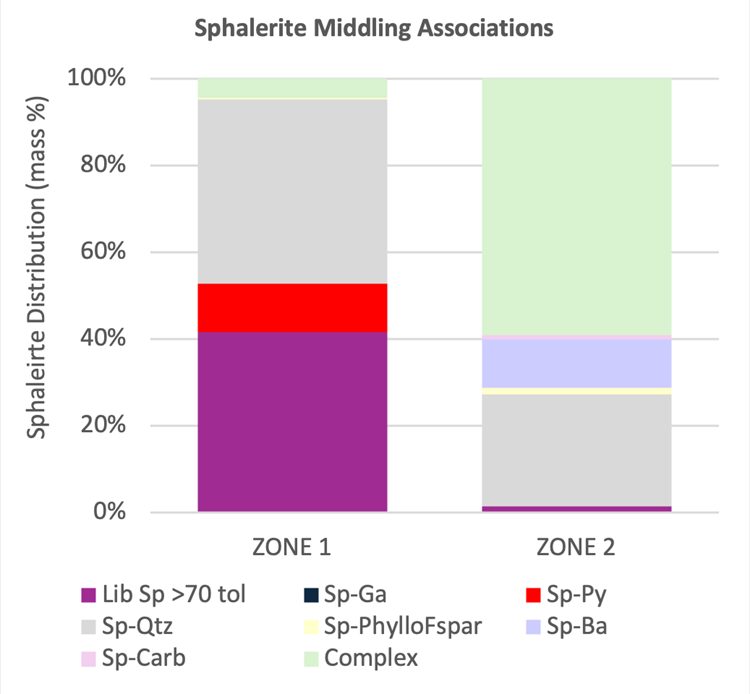
Figure 4. Key sphalerite gangue mineral middling associations in zones 1 and 2. Image Credit: Tescan
The middling groupings shown in Figure 4 are generated using the TIMA categorizers, with particle compositions defined by functions.
Figure 5 shows examples of sphalerite-gangue middling particles in Zone 1 and Zone 2, offering a distinct visual impression of the textural difference. Each chart segment measures 400 μm across. These particles can be identified through meticulous examination of the particle maps presented in Figure 2.
Interrogating the sphalerite middling particles further reveals the actual grain-size distribution of sphalerite in each category. This is critical for regrind, as middlings with pyrite will be gathered to a rougher concentrate, whereas those in non-sulfide gangue may report to the tail, requiring subsequent regrinding.
While both zones exhibit a sphalerite grain population between 210 μm (65 mesh) and 841 μm (20 mesh), Zone 2 displays a significantly higher population of fine sphalerite under 105 μm (150 mesh), particularly in the complex middlings class. The p20 (20% passing) size for sphalerite in complex middlings was roughly 100 μm in Zone 1 and 40 μm in Zone 2, signifying the potential regrind size requirement (see Figure 6).
Summary
TIMA analysis of drill-core intervals can provide valuable mineralogical and ore textural information at a mining scale. This article has detailed an approach for quantifying critical mineral indices, including ore mineral abundance, grain size distribution, liberation, middling associations, and grain size distribution per middling type, as the metallurgical flowsheet is being established.
This approach can be employed in early-stage projects to provide an initial look into metallurgical response variability. Furthermore, it can be used in geometallurgical programs to guide decisions on 1) flowsheet selection, 2) optimal grind/regrind size, and 3) ore blending approaches.
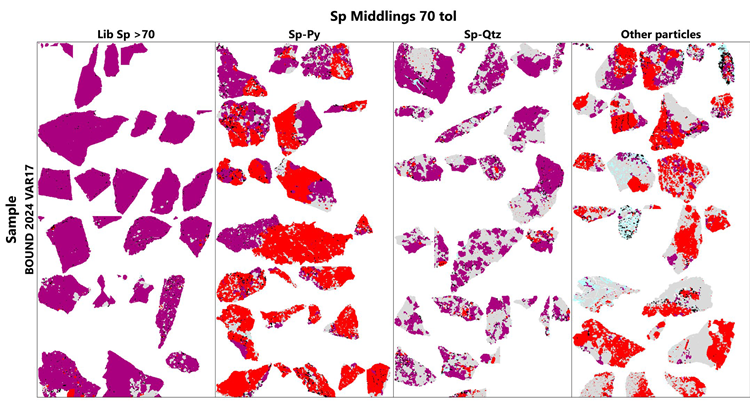
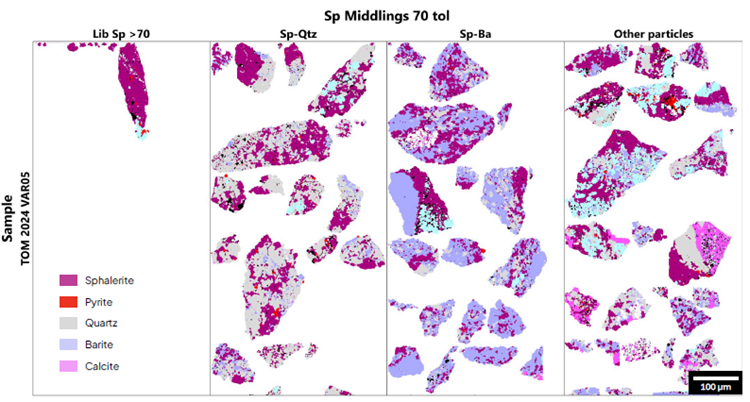
Figure 5. Sphalerite middling maps. Sphalerite liberation tolerance was set to 70%. TOP: Zone 1. BOTTOM: Zone 2. Image Credit: Tescan
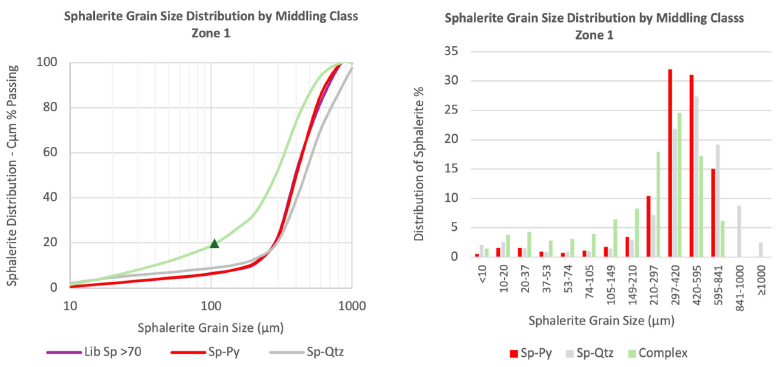
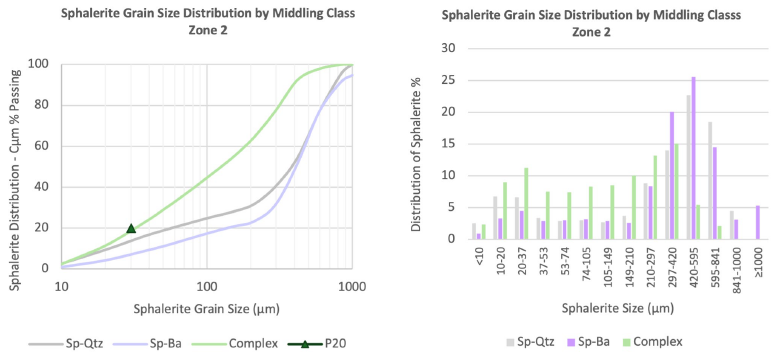
Figure 6. Sphalerite grain size distribution per middling class. Image Credit: Tescan
Acknowledgments
Produced from materials originally authored by Nichola McKay, Blue Coast Research Ltd., British Columbia, Canada.

This information has been sourced, reviewed, and adapted from materials provided by TESCAN.
For more information on this source, please visit TESCAN.