Sponsored by TescanReviewed by Ify IsiborJul 23 2026
In porous media, salt crystallization is a common phenomenon across many domains, including building materials, soils, conservation of cultural heritage, and subsurface geological formations used for gas and energy storage.
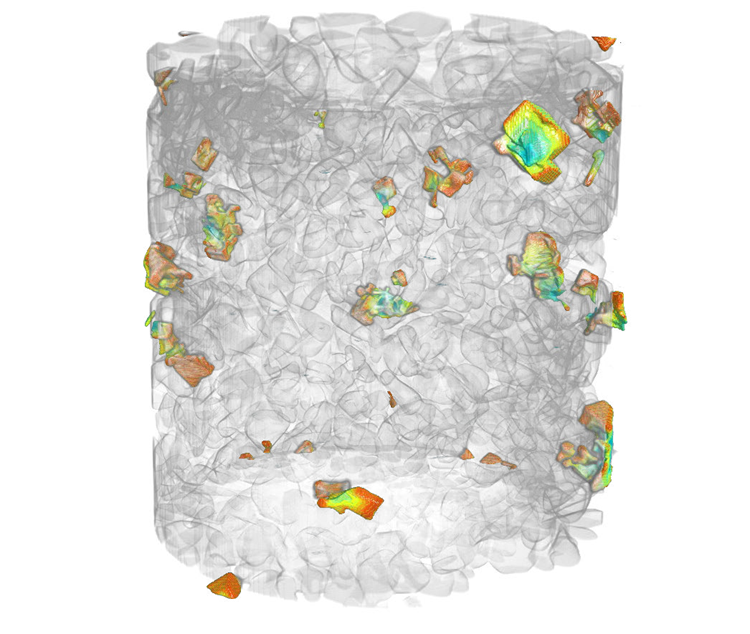
Overview of cooling-induced salt crystallization captured by dynamic micro-CT, revealing when and where crystal growth occurs throughout the porous structure. Image Credit: Tescan
Salt crystallization takes place when changes in temperature, moisture content, saturation, or solution composition cause dissolved salt to surpass its solubility limit and form crystals. The generated crystals can then modify the pore structure by occupying available pore space and lowering pore connectivity.
In systems where fluid transport is crucial, this might change the flow characteristics of the porous medium; in other cases, salt crystals can produce local stresses that can eventually lead to cumulative material degradation.
One notable example is crystallization triggered by cooling in building materials exposed to maritime environments. Here, salt-rich water can penetrate the pore structure and crystallize due to changes in ambient circumstances, such as cooling or freezing.
Although the effects of crystallization are often visible on a large scale, the controlling mechanisms occur much deeper, at the pore level.
Understanding these principles necessitates techniques that can record where crystals first develop, how they grow, and how they dissolve when conditions change. To this end, micro-CT imaging offers a powerful, non-destructive method for visualizing these internal changes at the pore scale in three dimensions.
Nucleation and crystal development are governed by local pore geometry and changing thermodynamic conditions, making crystallization initiation challenging to anticipate in both space and time. Dynamic micro-CT imaging overcomes this issue by imaging the sample without interruption, allowing for real-time observations.
By imaging the sample during in situ studies, it becomes possible to capture the evolution of crystal growth.
This article presents in situ cooling tests captured dynamically using the Tescan UniTOM® HR. Using this one-of-a-kind technique, the researchers were able to capture cooling-induced crystallization and subsequent dissolution inside a porous sample in real time during repeated in situ cycles.
In addition, a thorough, high-resolution image was obtained after the final crystallization stage, facilitating investigation of the shape and distribution of single crystals within the pore space.
Materials and Methods
To capture cooling-induced salt crystallization within the pore structure, an in situ setup capable of dynamic micro-CT imaging is required. In this experiment, a custom-built in situ stage with a core holder measuring 38 mm outside diameter and 23 mm inside diameter was used.
Figure 1(a) shows the in situ stage setup within the Tescan UniTOM® HR. A synthetic sintered glass sample (ROBU) with an average pore size of 160–250 µm, a diameter of 6 mm, and a length of 20 mm was used (Figure 1(a)).
The sample's porosity was estimated at 0.38 during image post-processing. The sample was wrapped with a PTFE heat-shrink tube to prevent salt deposition on its exterior surface, then placed in a plastic container to minimize drying during the experiment.
Prior to the start of the dynamic experiment, the sample was completely saturated with a KCl solution made by dissolving 33.4 g of KCl in 100 g of water.
The solution concentration was chosen to be just under the solubility limit at room temperature. The sample was cooled from 30 ºC to -2 ºC, inducing crystallization within the pore space. Cooling was accomplished by passing cold gaseous nitrogen (referred to as cold air hereafter) over the sample. (Figure 1(b)).
The cold air was produced by controlled heating of liquid nitrogen inside a liquid nitrogen container, permitting temperature modulation by changing the gas flow.
During cold-air injection, the sample was imaged constantly to capture the crystal formation throughout cooling. Then, cold air injection was discontinued, and the sample was allowed to warm up (Figure 1(c)).
The dynamic imaging tracked crystal disintegration as it occurred during heating. During dynamic imaging, the temperature inside the sample was measured using the software of the in situ stage.
To ensure reproducibility, this method included two crystallization-dissolution cycles, followed by an additional cooling stage. Following the last cooling stage, the sample was photographed with better resolution.
All scans were performed on the Tescan UniTOM® HR microCT system, which has submicron spatial resolution and real dynamic (4D) CT imaging capabilities.
Its large cabinet allowed for an experimental setup with cold-air injection from the top, and the heavy-load stage made it easier to mount and support the in situ stage used in the experiment.
The system's multi-detector structure enables optimization of imaging conditions, with a high-speed detector for fast dynamic imaging and a high-resolution flat panel detector for the final high-resolution scan.
This facilitated both time-resolved analysis and comprehensive structural characterization of the crystals and their clusters. The powerful 4D acquisition and reconstruction software enabled continuous scanning and observation of the dynamic crystallization process.
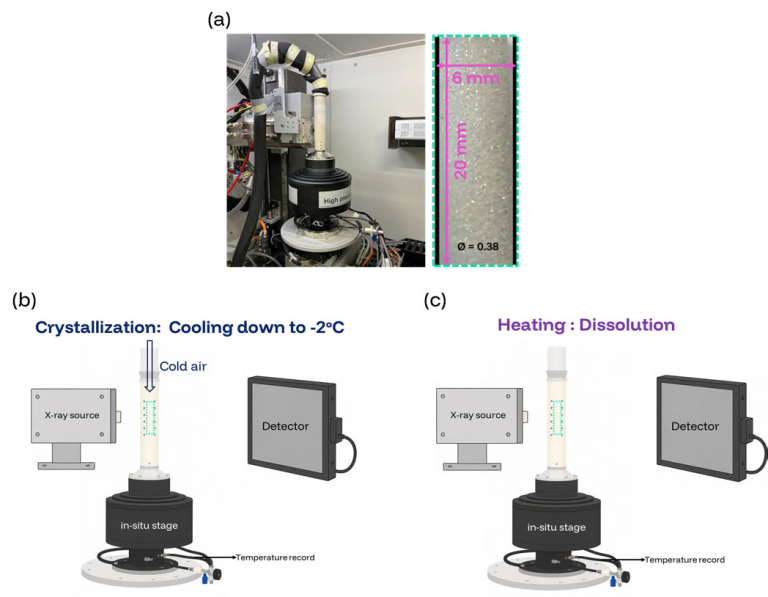
Figure 1. Experimental workflow. (a) Picture of the in situ stage on the Tescan UniTOM® HR. Right: picture of the sintered glass sample, enlarged for representation. Bottom: schematic view of the experimental setup during (b) crystallization and (c) dissolution. Image Credit: Tescan
Table 1. Scan parameters used for dynamic imaging. Source: Tescan
| Dynamic imaging parameters |
| Tube voltage |
120 kV |
| Voxel size |
9 μm |
| Total scan time |
33 minutes |
| Temporal resolution (time/360 ° rotation) |
1 minute 33 seconds |
| Total number of scans |
140 |
| Detector |
High-speed flat panel |
Table 2. Scan parameters used for detailed high-resolution imaging. Source: Tescan
| High resolution imaging parameters |
| Tube voltage |
140 kV |
| Voxel size |
1.5 μm |
| Scan time |
48 minutes |
| Detector |
High-resolution flat panel |
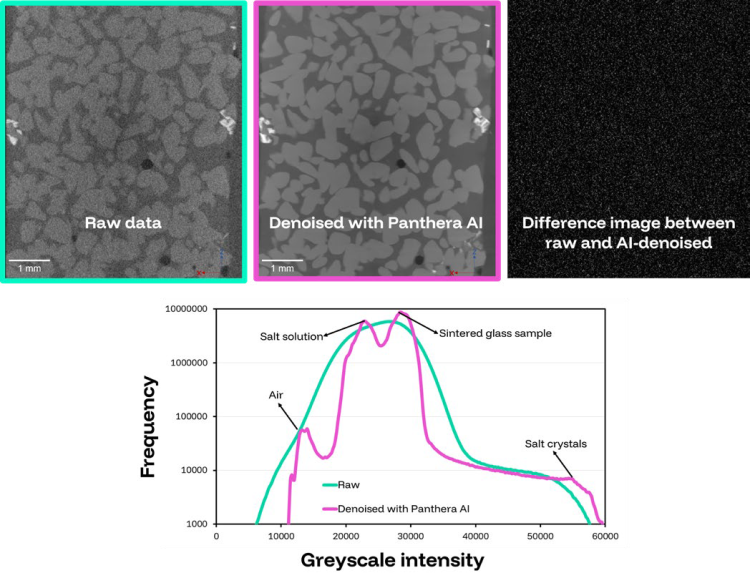
Figure 2. Comparison of raw and AI-denoised slices. Top left: raw XZ slice. Top middle: XZ slice denoised by Panthera™ AI. Top right: difference image between the raw and AI-denoised XZ slices.
Bottom: Histograms of the raw and AI-denoised 3D datasets, showing the effect of denoising on the grayscale intensity distribution. In the denoised with Panthera™ AI curve, the peaks correspond to air bubbles, salt solution, the sintered glass sample, and salt crystals, respectively, from lower to higher grayscale intensity values. Image Credit: Tescan
Panthera™ software, developed in-house, was used to rebuild and evaluate the datasets. AI denoising was used to minimize image noise while preserving structural information in the rebuilt images (Figure 2).
Figure 2 shows the raw data histogram, which shows a broad intensity with poorly defined peaks due to the high noise level. Denoising using Panthera™ AI reveals distinct peaks for each phase. The datasets were quantitatively analyzed using Avizo (Thermo Fisher Scientific, Avizo Software 2025.2).
Results and Discussion
The researchers used dynamic micro-CT imaging to record the intricacies of crystallization and dissolution within the pore space. The findings indicate that salt crystallization was geographically and temporally heterogeneous within the pore space after each crystallization step. Figure 3(a) shows the crystallization patterns following each crystallization condition.
To provide a more quantitative interpretation, pores containing salt were identified after each cycle to determine whether there was a memory effect. As shown in Figure 3(b), only 12% of the pores crystallize after each cycle, demonstrating no substantial memory effect between cycles.
By combining dynamic imaging data with quantitative analysis, it is possible to track not only the overall history of salt volume, but also the local changes of individual crystal clusters and dynamic voxel size changes across the entire dataset.
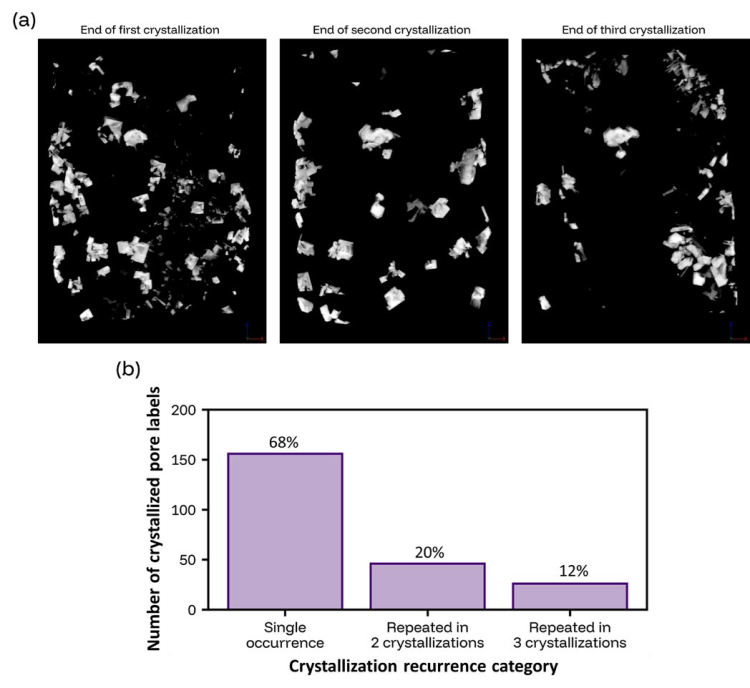
Figure 3. Crystallization patterns after each crystallization stage. (a) 3D representation of salt volume within the pore space, and (b) recurrence across crystallization cycles. Image Credit: Tescan
Figure 4 shows the overall progression of a representative crystallization-dissolution cycle. During active cooling, the total crystallized salt volume in the pore space rose, indicating that crystals formed and grew.
After the cold-air injection was ceased, the crystalline volume increased for many minutes until the sample warmed up. The volume of crystallized salt dropped again during subsequent passive warming as the crystals disintegrated.
The first crystals appeared within the pore space after about 10 minutes, and the crystalline volume returned to zero after about 70 minutes. This progression shows that the crystallization-dissolution process was reversible under the experimental conditions.
The slope of the total crystallized volume graph represents the apparent global rate of crystallization and dissolution during the imposed heat cycle.
Chilling was actively induced and relatively quick, whereas warming was passive and more gradual. Therefore, disparities between the growth and dissolution regions of the curve cannot be explained purely by intrinsic kinetic differences between crystallization and dissolution.
Figure 4 shows the global, sample-scale evolution of the total crystalline volume under the cooling-warming technique. To determine how individual crystals or crystal clusters evolve locally within this overall reaction, additional spatially resolved analysis is required.
While the overall crystallized volume is an important global indicator of the process, it does not disclose whether all crystal clusters evolve in the same way or if local growth and dissolution occur at different times inside the pore space.
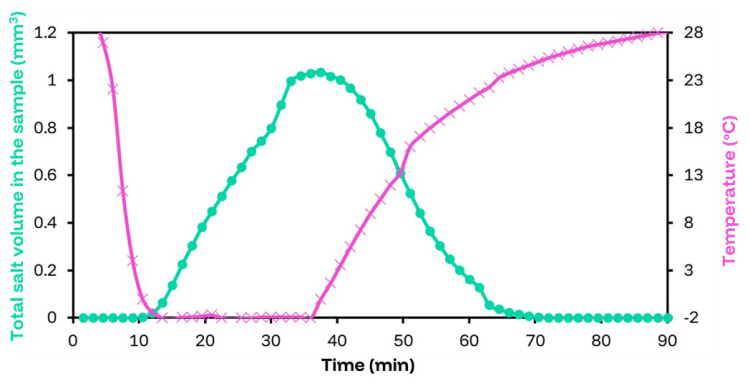
Figure 4. Total salt volume within the pore space of the sample at each time point during one crystallization-dissolution cycle. Pink line with cross markers shows the temperature of the system at each time point. Image Credit: Tescan
To investigate the local crystallization processes in greater detail, one sample crystal cluster was chosen, and volume-rendered pictures were created to show its growth and dissolution over time (Figure 5).
Dynamic micro-CT facilitates the tracking of the evolution of individual crystal clusters, including changes in size and morphology over time. During cooling, the cluster first emerged and then gradually expanded, taking up a bigger portion of the pore space.
During warming, the same cluster shrank progressively, leaving a small amount of residual crystalline volume. The first and last time points depicted represent the commencement of crystallization and the stage immediately preceding full dissolution, respectively.
This specialized analysis illustrates dynamic micro-CT's capacity to resolve crystal growth from the initial formation of individual crystals to the development of larger clusters, rather than just providing a system-wide response.
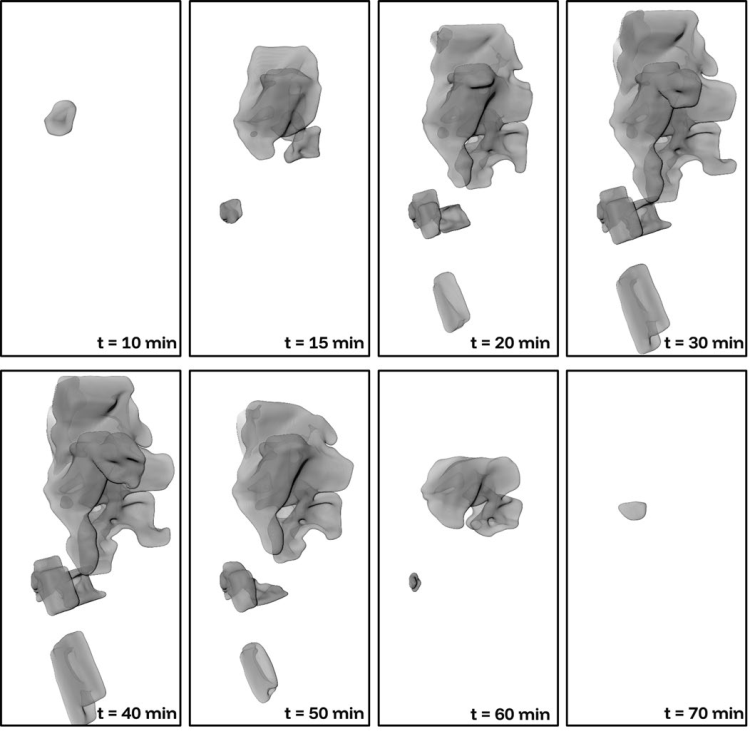
Figure 5. Volume rendering of the salt crystal in one selected pore, showing the evolution of crystal volume and morphology during one crystallization-dissolution cycle. Image Credit: Tescan
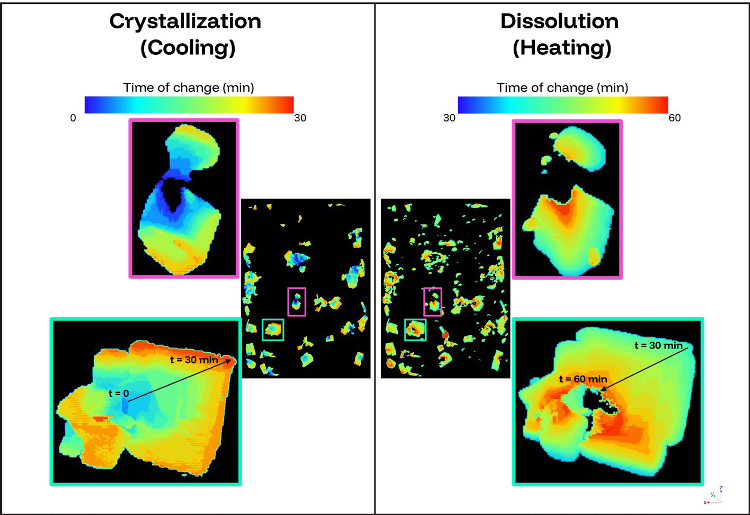
Figure 6. Flip-point analysis used to visualize the spatial and temporal evolution of one crystallization-dissolution cycle. The cooling stage (left) indicates voxel-level increases associated with crystallization. The dissolution stage (right) highlights voxel-level decreases during warming.
The color coding indicates the timing of the changes within crystals. The pink and green boxes show the enlarged views of the selected regions to illustrate the local progression of crystallization and dissolution in detail. Image Credit: Tescan
Although the volume-rendered sequence in Figure 5 shows the growth of a single cluster, a frame-by-frame depiction does not provide a complete quantitative description of when individual voxels crystallize or disintegrate.
To assess the process's spatial and temporal evolution, Panthera™ software was used to perform flip-point analysis on each dynamic dataset.
This method detects significant voxel-wise changes in grey value over time using a user-defined threshold and assigns the time point of the change to each voxel. The generated flip-point images reduce the 4D dataset to a single 3D volume representation.
In this study, flip-point analysis was performed separately on the crystallization and dissolution phases. Voxel-wise increases in gray value were used to track crystallization during cooling, while decreases were used to track dissolution during warming.
Individual crystal clusters' progression over time can be easily viewed using color coding to indicate the timing of identified changes.
The images in the left-hand panel demonstrate that during cooling, crystal formation moved toward the outside areas of the salt clusters, whereas during warming, dissolution appeared to go inside.
The dissolving crystal clusters lost connection at an early stage. These findings highlight the importance of dynamic imaging in determining where and when changes occur within a sample, which would be difficult to detect using static before-and-after imaging.
Following the in situ cooling experiments and dynamic imaging, a thorough high-resolution scan was performed to analyze crystal shape in greater detail, as shown in Figure 7.
The zoomed-in region in a 2D slice and the corresponding 3D volume indicate that the crystals occupied the pore space irregularly and thus did not form a single compact phase but instead followed the contour of the exterior grain structure. This suggests that the ultimate crystal shape is influenced by local pore geometry.
This high-resolution dataset enhances dynamic imaging by providing better detail to time-resolved observations. While dynamic imaging determines when and where crystallization and dissolution occur, a thorough high-resolution scan reveals how the crystals are organized within the pore structure.
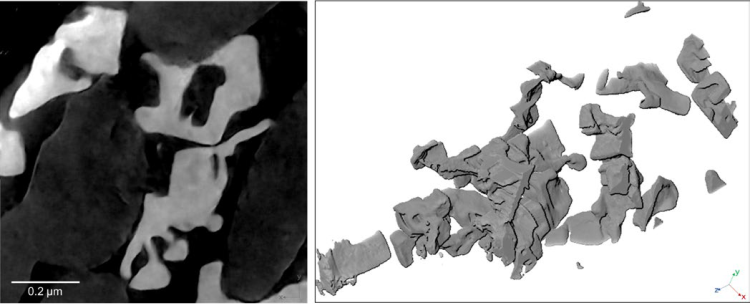
Figure 7. High-resolution imaging results after the final cooling stage. Left: XY slice. Right: 3D rendering of the crystallized salt in the selected sub-volume. Image Credit: Tescan
Conclusions and Outlook
This study reveals that dynamic micro-CT imaging is a reliable and non-destructive method for studying salt crystallization and dissolution processes directly at the pore scale.
Dynamic imaging captures ephemeral phenomena such as nucleation, rapid crystal growth, and progressive dissolution that are not possible to see using traditional time-lapse or before-and-after approaches.
The Tescan UniTOM® HR platform was used to monitor crystallization-induced changes both globally (total salt-volume evolution) and locally (individual crystal-cluster dynamics and voxel-level modifications).
Panthera™ combines dynamic datasets with advanced analysis tools, such as flip-point analysis, to transform complicated 4D data into clear, geographically and temporally resolved insights. Importantly, the combination of dynamic imaging and a subsequent high-resolution scan results in a comprehensive "dynamic-to-detail" approach.
This method connects the timing and position of crystallization events to the resulting crystal morphology, providing a comprehensive understanding of the process, from evolution to final structure, inside a single experimental setup.
Looking ahead, this technology can be used in a wide range of applications where crystallization is important, such as durability studies of building materials, subterranean energy systems, and the effects of fluid movement in porous media.
Dynamic micro-CT, which combines continuous imaging, in situ experimentation, and advanced data analysis, facilitates more accurate characterization of pore-scale processes and supports the development of predictive models of material behavior in changing environments.

This information has been sourced, reviewed, and adapted from materials provided by TESCAN.
For more information on this source, please visit TESCAN.