Urban mining is vital for recovering precious metals from electronic wastes, but the current methods have an enormous environmental impact. This article details a solvent-free and sustainable process by flash Joule heating to recover precious metals and remove hazardous heavy metals in electronic waste (e-waste). The process has been developed by Deng, B et al. and published in the Nature Communications journal.
Image Credit: Parilov/Shutterstock.com
E-waste is one of the growing concerns and above 40 million tons of e-waste are created each year. E-waste has many valuable metals and the concentrations of some precious metals in e-waste are higher than those in ores. Urban mining refers to the recovery of precious metals from e-waste. E-waste also contains huge amounts of heavy metals whose leakage can lead to both health and environmental hazards.
Urban mining faces obstacles such as a lack of high-yielding and environmentally friendly recovery processes. The conventional technique for e-waste recycling depends on a pyrometallurgy process that lacks selectivity, is energy-intensive, and needs high-grade precursors. The technique also generates hazardous fumes containing heavy metals.
Another method used is the hydrometallurgical process which is more selective but the leaching kinetics are usually slow. Biometallurgy is highly selective and environmentally friendly but it is still in its infancy.
This article elaborates on how the various vapor pressure of metals from that of substrate materials (carbon, ceramics, and glass) facilitates the separation of metals from e-waste, a process termed evaporative separation. In this method, the recovery yield was seen to be enhanced. The toxic heavy metals were removed and collected, thus minimizing the environmental impact and health risks of the recycling process.
Evaporative Separation of Precious Metals from E-Waste by FJH
The ultrafast flash Joule heating (FJH) process employed in the study to recover precious metals from e-waste includes three stages (see Figure 1a). The metals in e-waste were heated and evaporated through ultrahigh-temperature FJH. The metal vapors were then transferred under a vacuum and collected by condensation.
The starting material was a printed circuit board (PCB) from a discarded computer, and it was ground to small powder and mixed with carbon black (CB), which acted as the conductive additive (see Figure 1b, inset). The PCB was digested with dilute aqua regia19 and the concentration of precious metals was determined by inductively coupled plasma mass spectrometry (ICP-MS).
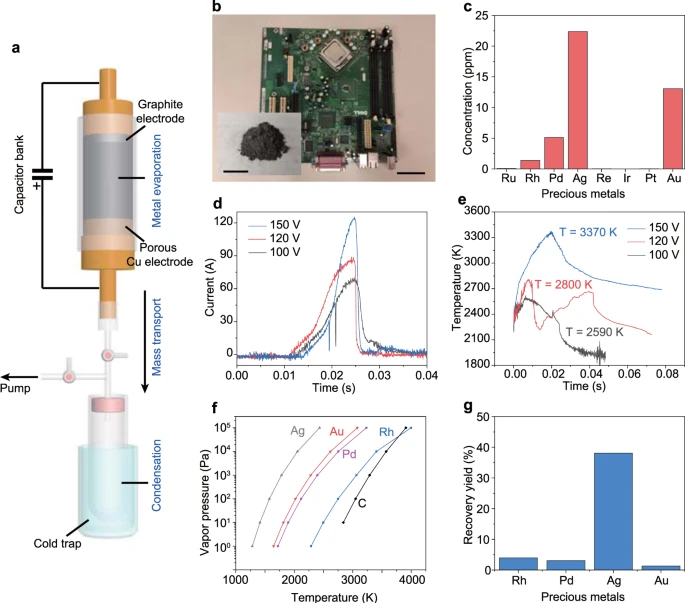
Figure 1. Recovery of precious metals by flash Joule heating (FJH). (a) Schematic of the FJH and evaporative separation system. The system was composed of three parts, including FJH for metal evaporation, the vacuum system for mass transport, and the cold trap for volatiles condensation. (b) Picture of a printed circuit board (PCB). Scale bar, 5 cm. Inset, the mixture of carbon black (CB) with PCB powder. Scale bar, 2 cm. (c) Concentrations of precious metals in PCB as determined by inductively coupled plasma mass spectrometry (ICP-MS). (d) Currents vs time recorded under different FJH voltages. (e) Real-time temperature measurements at different FJH voltages by fitting blackbody radiation emitted from the sample. (f) Vapor pressure–temperature relationship of precious metals and carbon. (g) Recovery yield of precious metals by condensing the evaporated gas components. The recovery yield is the average of three independent FJH experiments (n = 3). Image Credit: Deng, et al., 2021.
The mixture of PCB powder and ~30 wt% CB were slightly compressed inside a quartz tube between two sealed electrodes. The current passing through the sample was calculated under different FJH voltages (see Figure 1d) and the temperature differed depending on the FJH voltage, reaching ~3400 K at 150 V in <50 ms (Figure 1e).
High temperature (>3000 K) volatilizes most of the non-carbon components and thus the metals are evaporated. The evaporated metal vapors were captured by condensation in a cold trap. The content of the precious metals in the condensed solid was measured and the recovery yield was calculated.
Halide-Assisted Improvement of Recovery Yield
Recovery was enhanced with the use of halides as additives due to the much higher vapor pressure of metal halides compared with the elemental metals. The presence of additives increased the recovery yields (see Figure 2).
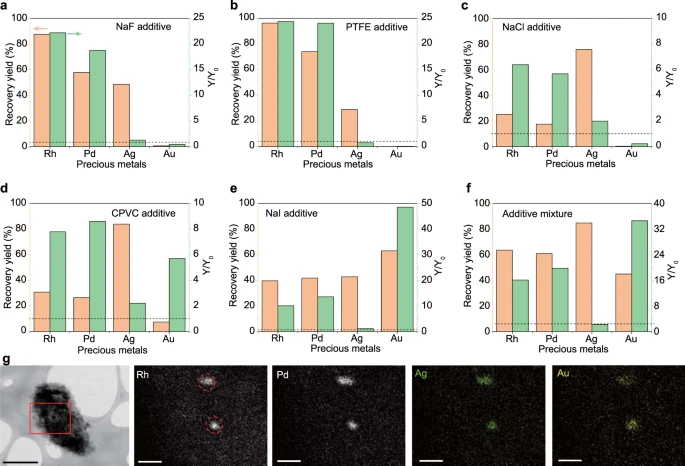
Figure 2. Halide-assisted improvement of recovery yield. Recovery yield of precious metals by using (a) NaF, (b) PTFE, (c) NaCl, (d) CPVC, (e) NaI, and (f) mixture of NaF, NaCl, and NaI, as additives. Y0 and Y mean the recovery yield of precious metals without and with additives, respectively. The dashed line denotes Y/Y0 = 1, meaning that there is no advantage of the additive if Y/Y0 ≤ 1. The recovery yields were the average of three independent flash Joule heating (FJH) experiments (n = 3). (g) Scanning transmission electron microscopy (STEM) image of the collected solids, and energy dispersive spectroscopy (EDS) maps of Rh, Pd, Ag, and Au at the rectangular region. Scale bar in STEM image, 0.5 μm; scale bars in EDS maps, 100 nm. The dashed circles in Rh show the clustered alloys. Image Credit: Deng, et al., 2021.
Different additives such as fluorine, chlorine, iodine were added, but the recovery yields of all four precious metals increased when sodium iodide (NaI) was used as the additive. The composition analysis of the raw materials and the remaining solid after FJH through X-ray photoemission spectroscopy (XPS) showed that 10%–40% of the halide additives were evaporated during the FJH process.
The morphology and chemical composition of the condensed solids were characterized using scanning transmission electron microscopy (STEM) and energy dispersion spectroscopy (EDS).
Improved Leaching Efficiency of Precious Metals by FJH
Leaching the residual solids obtained through FJH was the other pathway employed to recover the precious metals. This involved a pressurized setup to capture the metals in the reactor (see Figure 3).
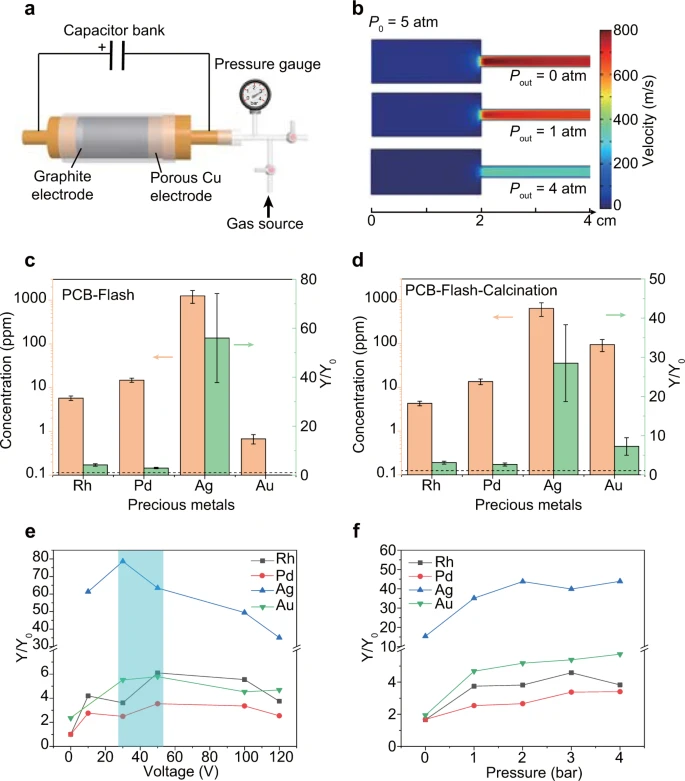
Figure 3. Leaching efficiency improvement of precious metals by the flash Joule heating (FJH) process. (a) Schematic of the pressurized setup for FJH. (b) Gas flow simulation under different pressures. The inner pressure (P0) during the FJH was calculated to be ~5 atm. Pout of 0 atm, 1 atm, and 4 atm corresponds to the FJH under vacuum, atmospheric pressure, and 3 atm of positive pressure. (c) Concentration of precious metals and improvement of recovery yield by FJH. Y0 and Y mean the recovery yield by leaching printed circuit board (PCB) and PCB-Flash, respectively. The dashed line denotes Y/Y0 = 1. The error bars denote the standard deviation where n = 3. (d) Concentration of precious metals and improvement of recovery yield by FJH and calcination. Y0 and Y mean the recovery yield by leaching PCB and PCB-Flash-Calcination, respectively. The dashed line denotes Y/Y0 = 1. The error bars denote the standard deviation where n = 3. (e) Improvement of recovery yield varied with FJH voltages under atmospheric pressure. The highlighted region is the approximate optimal voltage for all metal recovery. (f) Improvement of recovery yield varied with pressure. For (e) and (f), the recovery yields of Rh, Pd, and Ag are calculated from PCB-Flash, and the recovery yield of Au is calculated from PCB-Flash-Calcination. Image Credit: Deng, et al., 2021.
The combination of FJH and leaching was much effective when compared with leaching alone. The XPS analysis demonstrated the efficient removal of carbon by calcination. The study also analyzed the effects of the FJH voltage and pressure on the recovery yield and demonstrated that the modest FJH voltages between 30 and 50 V resulted in the best recovery yield (see Figure 3e).
Removal and Collection of Toxic Heavy Metals in E-Waste
The capability of the FJH process to remove heavy metals was assessed (see Figure 4). The removal efficiencies were consistent with their vapor pressure values.
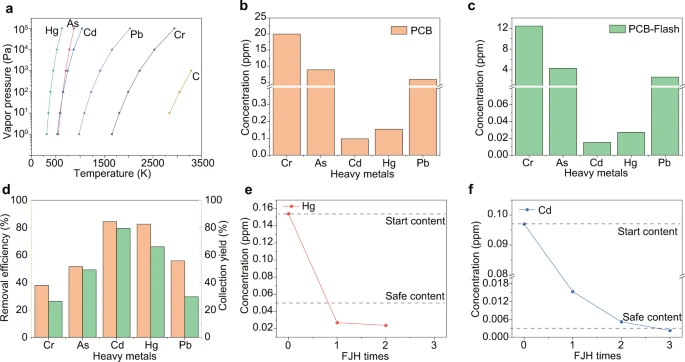
Figure 4. Removal of heavy metals in e-waste by flash Joule heating (FJH) process. (a) Vapor pressure–temperature relationships of toxic heavy metals and carbon. (b) Concentrations of toxic heavy metals in the printed circuit board (PCB). (c) Concentrations of toxic heavy metals in PCB after FJH. (d) Removal efficiency and collection yield of heavy metals. The efficiency and yield were the averages of three independent FJH experiments (n = 3). (e) Concentration of Hg in the residues after multiple FJH reactions. (f) Concentration of Cd in the residues after multiple FJH reactions. The dashed lines in (e, f) represent the starting contents and the approved World Health Organization (WHO) level for safe limits of agricultural soils. The concentration of heavy metals in the residue solids can be reduced further by multiple FJH reactions. Image Credit: Deng, et al., 2021.
Discussion
The process described in the article majorly targets the recovery of metals from e-waste. The various recovery yields of precious metals revealed the separation feasibility of the FJH process based on the vapor pressure difference.
The introduction of chemical additives also regulated the separation of the precious metal presumably due to their different chemical reactivity. The separation capability of the evaporative separation scheme can also be further enhanced by progressively increasing the FJH temperature.
FJH is a very effective heating process and has an energy consumption of ~939 kWh ton−1. Moreover, the FJH process is scalable. This FJH process to recover metals from e-waste can be a precursor for near-future recovery methods.
Methodology
Materials
The conductive additive was CB and the PCB waste was from a discarded computer. NaCl and NaI were used as salt additives. The precious metals chlorides were PdCl2,RhCl3, AuCl3, and AgCl. Polytetrafluoroethylene (PTFE) powder was purchased. PVC, CPVC, and polyvinylidene fluoride (PVDF) were extracted from plumbing pipes.
FJH System and Evaporative Separation Process
The reactants were loaded into a quartz tube and copper wool was used as the porous electrode on one side to enable gas diffusion, and a graphite rod was used as the electrode on the other side of the quartz tube. Upon completion of the FJH reaction, the apparatus was cooled while the cold trap remained immersed in the liquid N2.
FJH Under Atmospheric and Positive Pressure
The FJH reaction resembles the evaporative separation but has some changes. The quartz tube was sealed by an O-ring to hold pressure and once the pressure was set, the FJH system was charged and then discharged for reaction. Upon completion of the FJH reaction, the pressure was released, and the sample was removed for further analysis.
Characterization
The SEM images were obtained and XPS spectra were taken. Elemental XPS spectra were also determined. STEM images and EDS maps were obtained from a Field Emission Gun Transmission Electron Microscope. Calcination was carried out using the Mafu furnace in the air.
Sample Digestion and ICP-MS Measurement
The samples were digested by using a diluted aqua regia method. Undissolved particles were removed by filtration and the solution was diluted to the appropriate concentration.
Journal Reference:
Deng, B., Luong, D. X., Wang, Z., Kittrell, C., McHugh, E. A., Tour, J. M. (2021) Urban mining by flash Joule heating. Nature Communications volume, 12(5794). Available at: https://www.nature.com/articles/s41467-021-26038-9.
References and Further Reading
- Zhang, K., et al. (2012) E-waste recycling: where does it go from here? Environmental Science Technology, 46, pp. 10861–10867. doi.org/10.1021/es303166s.
- Zeng, X. L., et al. (2018) Urban Mining of E-Waste is Becoming More Cost-Effective Than Virgin Mining. Environmental Science Technology, 52, pp. 4835–4841. https://doi.org/10.1021/acs.est.7b04909.
- Ogunseitan, O. A., et al. (2009) The electronics revolution: From e-wonderland to e-wasteland. Science, 326, pp. 670–671. doi.org/10.1126/science.1176929.
- Wang, Z. H., et al. (2016) Take responsibility for electronic-waste disposal. Nature, 536, pp. 23–25. doi.org/10.1038/536023a.
- Ghosh, B., et al. (2015) Waste printed circuit boards recycling: an extensive assessment of current status. Journal of Cleaner Production, 94, pp. 5–19 doi.org/10.1016/j.jclepro.2015.02.024.
- Leung, A. O. W., et al. (2008) Heavy metals concentrations of surface dust from e-waste recycling and its human health implications in southeast China. Environmental Science Technology, 42, pp. 2674–2680. doi.org/10.1021/es071873x.
- Julander, A., et al. (2014) Formal recycling of e-waste leads to increased exposure to toxic metals: an occupational exposure study from Sweden. Environment International, 73, pp. 243–251. doi.org/10.1016/j.envint.2014.07.006.
- Awasthi, A. K., et al. (2019) Circular economy and electronic waste. Nature Electronics, 2, pp. 86–89. doi.org/10.1038/s41928-019-0225-2.
- Kaya, M (2016) Recovery of metals and nonmetals from electronic waste by physical and chemical recycling processes. Waste Management, 57, pp. 64–90. doi.org/10.1016/j.wasman.2016.08.004.
- Popoola, O. E., et al. (2019) Levels of awareness and concentrations of heavy metals in the blood of electronic waste scavengers in Nigeria. Journal of Health Pollution, 9, p. 190311. doi.org/10.5696/2156-9614-9.21.190311.
- Hall, W J & Williams, P T (2007) Separation and recovery of materials from scrap printed circuit boards. Resources, Conservation & Recycling, 51, pp. 691–709. doi.org/10.1016/j.resconrec.2006.11.010.
- Cui, J R & Zhang, L F (2008) Metallurgical recovery of metals from electronic waste: a review. Journal of Hazardous Materials, 158, pp. 228–256. doi.org/10.1016/j.jhazmat.2008.02.001.
- Sun, Z., et al. Toward sustainability for recovery of critical metals from electronic waste: the hydrochemistry processes. ACS Sustainable Chemistry & Engineering, 5, pp. 21–40. doi.org/10.1021/acssuschemeng.6b00841.
- Jadhav, U & Hocheng, H C (2015) Hydrometallurgical recovery of metals from large printed circuit board pieces. Scientific Reports, 5, p. 14574. doi.org/10.1038/srep14574.
- Zhuang, W. Q., et al. (2015) Recovery of critical metals using biometallurgy. Current Opinion in Biotechnology, 33, pp. 327–335. doi.org/10.1016/j.copbio.2015.03.019.
- Sarvar, M., et al. (2015) Characterization and mechanical separation of metals from computer printed circuit boards (PCBs) based on mineral processing methods. Waste Management, 45, pp. 246–257. doi.org/10.1016/j.wasman.2015.06.020.
- Yamane, L. H., et al. (2011) Recycling of WEEE: characterization of spent printed circuit boards from mobile phones and computers. Waste Management, 31, pp. 2553–2558. doi.org/10.1016/j.wasman.2011.07.006.
- Sethurajan, M., et al. (2019) Recent advances on hydrometallurgical recovery of critical and precious elements from end of life electronic wastes-a review. Critical Reviews in Environmental Science and Technology, 49, pp. 212–275 doi.org/10.1080/10643389.2018.1540760.
- Hong, Y., et al. (2020) Precious metal recovery from electronic waste by a porous porphyrin polymer. Proceedings of the National Academy of Sciences, 117, pp. 16174–16180. doi.org/10.1073/pnas.2000606117.
- Abrahamson, J (1974) Graphite sublimation temperatures, carbon arcs and crystalline erosion. Carbon, 12, pp. 111–141. doi.org/10.1016/0008-6223(74)90019-0.
- Luong, D. X., et al. (2020) Gram-scale bottom-up flash graphene synthesis. Nature, 577, pp. 647–651. doi.org/10.1038/s41586-020-1938-0.
- Algozeeb, W. A., et al. (2020) Flash graphene from plastic waste. ACS Nano, 14, pp. 15595–15604. doi.org/10.1021/acsnano.0c06328.
- Okamoto, H (2016) ASM Handbook Volume 3: Alloy Phase Diagrams.
- Lide, D R (2005) CRC Handbook of Chemistry and Physics, Ch. 4.
- Pearson, R G (1963) Hard and soft acids and bases. Journal of American Chemical Society, 85, pp. 3533–3539. doi.org/10.1021/ja00905a001.
- Ueda, T (2016) Metal Sustainability: Global Challenges, Consequences, and Prospects, Ch. 15.
- Yao, Y. G., et al. (2018) Carbothermal shock synthesis of high-entropy-alloy nanoparticles. Science, 359, pp. 1489–1494. doi.org/10.1126/science.aan5412.
- Olavarria-Contreras, I. J., et al. (2016) C-Au covalently bonded molecular junctions using nonprotected alkynyl anchoring groups. Journal of American Chemical Society, 138, pp. 8465–8469. doi.org/10.1021/jacs.6b03383.
- Park, Y J & Fray, D J (2009) Recovery of high purity precious metals from printed circuit boards. Journal of Hazardous Materials, 164, pp. 1152–1158. doi.org/10.1016/j.jhazmat.2008.09.043.
- Quinet, P., et al. (2005) Recovery of precious metals from electronic scrap by hydrometallurgical processing routes. Mining, Metallurgy & Exploration, 22, pp. 17–22. doi.org/10.1007/BF03403191.
- Sun, G. L., et al. (2020) Using yeast to sustainably remediate and extract heavy metals from waste waters. Nature Sustainability, 3, pp. 303–311. doi.org/10.1038/s41893-020-0478-9.
- Kinuthia, G. K., et al. (2020) Levels of heavy metals in wastewater and soil samples from open drainage channels in Nairobi, Kenya: community health implication. Scientific Reports, 10, p. 8434. doi.org/10.1038/s41598-020-65359-5.
- Khaliq, A., et al. (2014) Metal extraction processes for electronic waste and existing industrial routes: a review and Australian perspective. Resources, 3, pp. 152–179. doi.org/10.3390/resources3010152.
- Balaji, R & Senophiyah-Mary, J (2020) Urban Mining and Sustainable Waste Management, Ch. 7.
- Theo, L (1998) Integrated recycling of non-ferrous metals at Boliden Ltd. Ronnskar smelter. In: Proceedings of the 1998 IEEE International Symposium on Electronics and the Environment (ISEE). doi.org/10.1109/ISEE.1998.675028.